
Managing 21 brand accounts profitably through Amazon 3P strategy and brand control
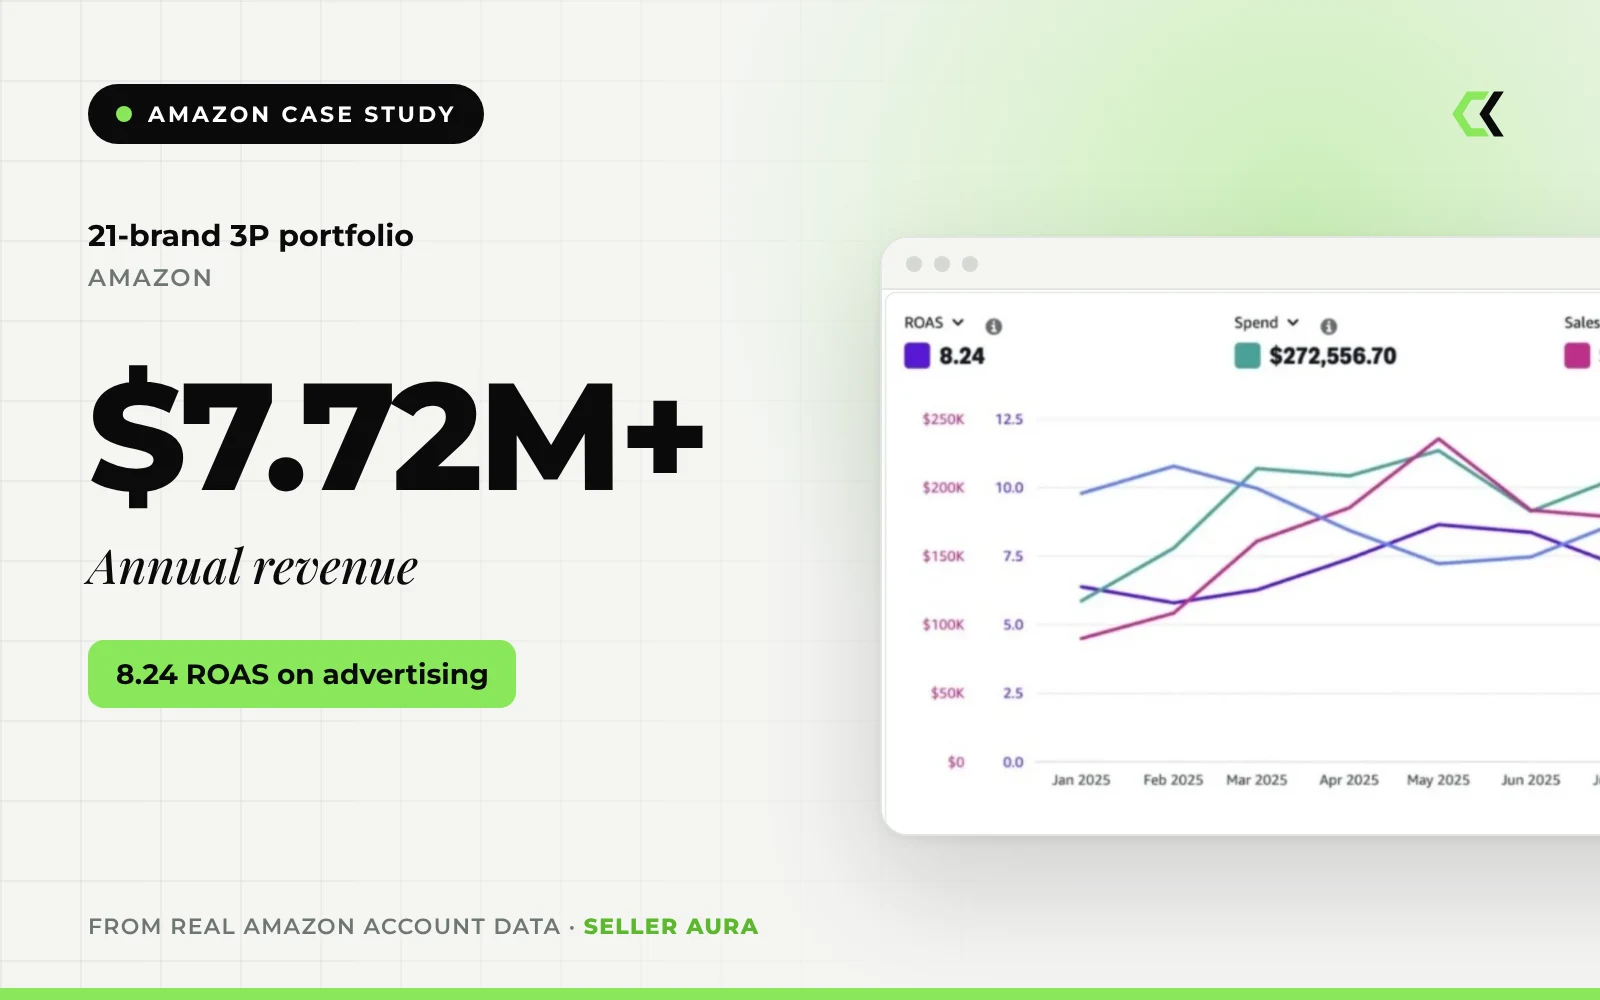
An authorised Amazon 3P brand partner scaled to more than $7.72M in annual revenue by bringing Brand Registry control, PPC, retention and profit recovery into one operating framework across 21 brands.
The account
The client is an experienced Amazon 3P seller operating as an authorised brand partner, with Brand Registry administration across 21 brand accounts in multiple categories. That gave full control over catalogues, advertising and brand protection, but at this scale margins, repeat cycles and inventory became difficult to manage.
Seller AURA implemented a structured 3P brand management framework designed to improve average order value, repeat orders, profitability and operational control across the whole portfolio.
What was holding growth back
Fragmented Amazon execution
SEO, PPC, pricing and inventory ran separately across brands, causing inconsistent IPI scores and Buy Box instability.
Declining margins at scale
TACoS crept up as revenue grew, and low-AOV SKUs without bundles made growth dependent on ad spend.
Weak repeat purchase economics
Growth came from first-time buyers, Subscribe & Save adoption was low and past buyers were not retargeted.
Buy Box instability
Unauthorised resellers created pricing conflicts and leaked PPC traffic to lower-priced offers.
Unrecovered FBA losses
Unclaimed reimbursements, inefficient restocking and storage fees eroded profit each month.
How Seller AURA approached it
Unified catalogue, SEO and PPC
One operating framework across brands, so proven strategies could be replicated instead of rebuilt per account.
Virtual bundles and pack sizes
Bundles, multi-packs and tiered pricing raised AOV and contribution margin.
Lifecycle and retention
High-reorder SKUs were identified and Subscribe & Save expanded with tiered 5–10% discounts and lead-in coupons.
Amazon Marketing Cloud audiences
Advertising moved beyond keywords to AMC audiences built on purchase behaviour and ad-exposure history.
Operational profit recovery
18-month rolling FBA reimbursement audits, and restock forecasting that held 85%+ in-stock on priority ASINs.
What changed
- $7.72M+ in ordered product sales across 240,474 units in the first 12 months, at a $34.24 average order value.
- $2,245,787.70 in ad sales from $272,556.70 in ad spend during 2025: ROAS 8.24 at 12.14% ACoS, holding steady as spend scaled.
- AMC audience campaigns added more than $240K in sales from $48.8K in spend (ROAS 4.92).
- Subscribe & Save grew to more than 5,000 active subscriptions, at roughly 10–12% of total sales.
- $151,878.53 recovered through in-house FBA reimbursement audits in 2025, with no third-party recovery fees.
Straight from the account
Unedited screenshots from Amazon Seller Central, the Advertising Console and the account's reporting tools, with date ranges left visible.
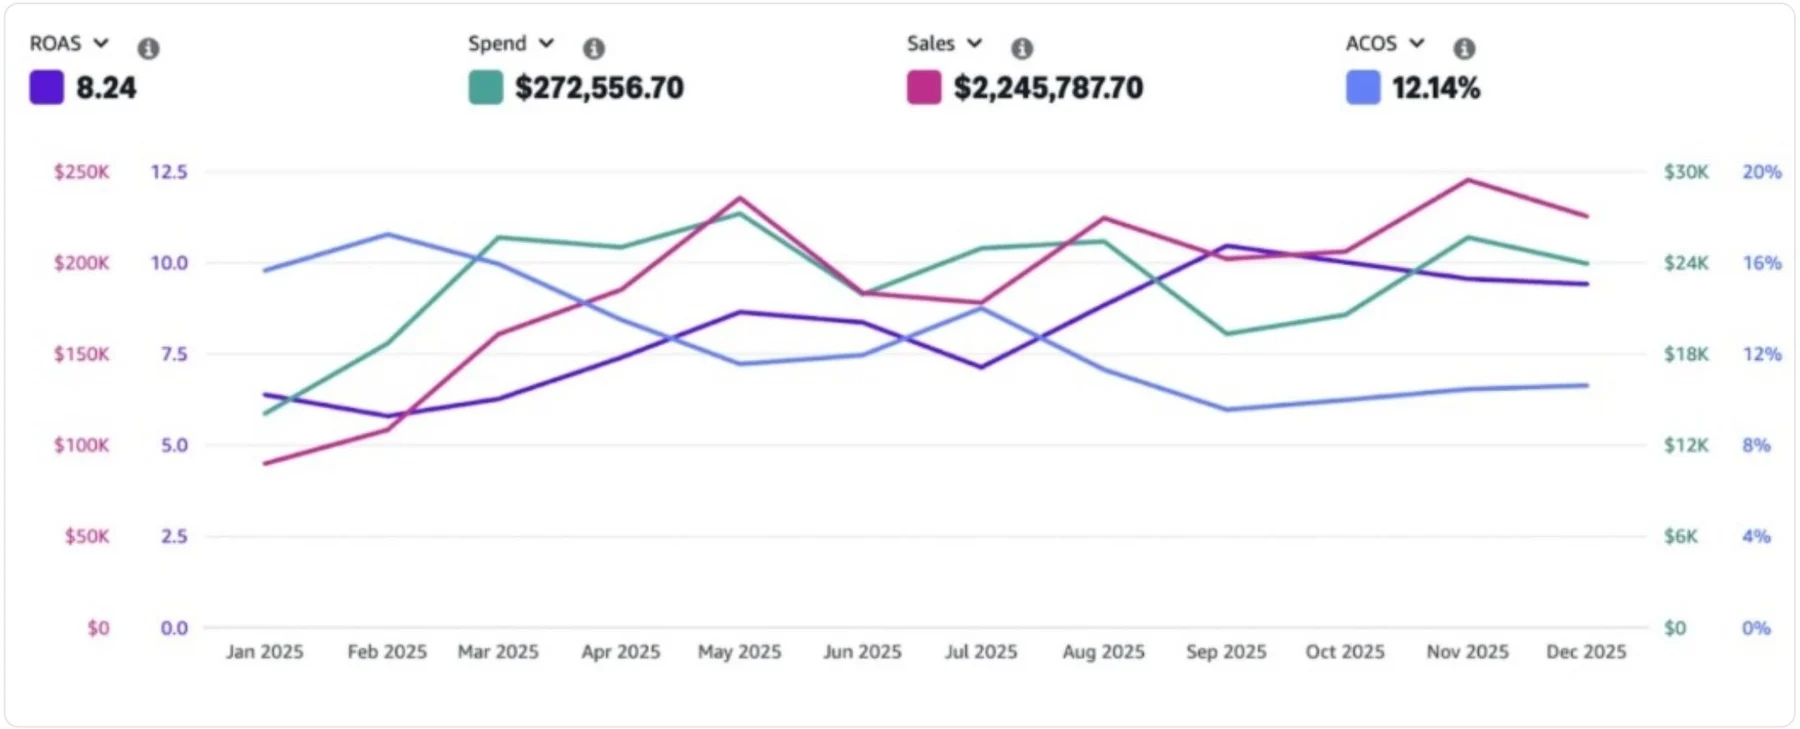
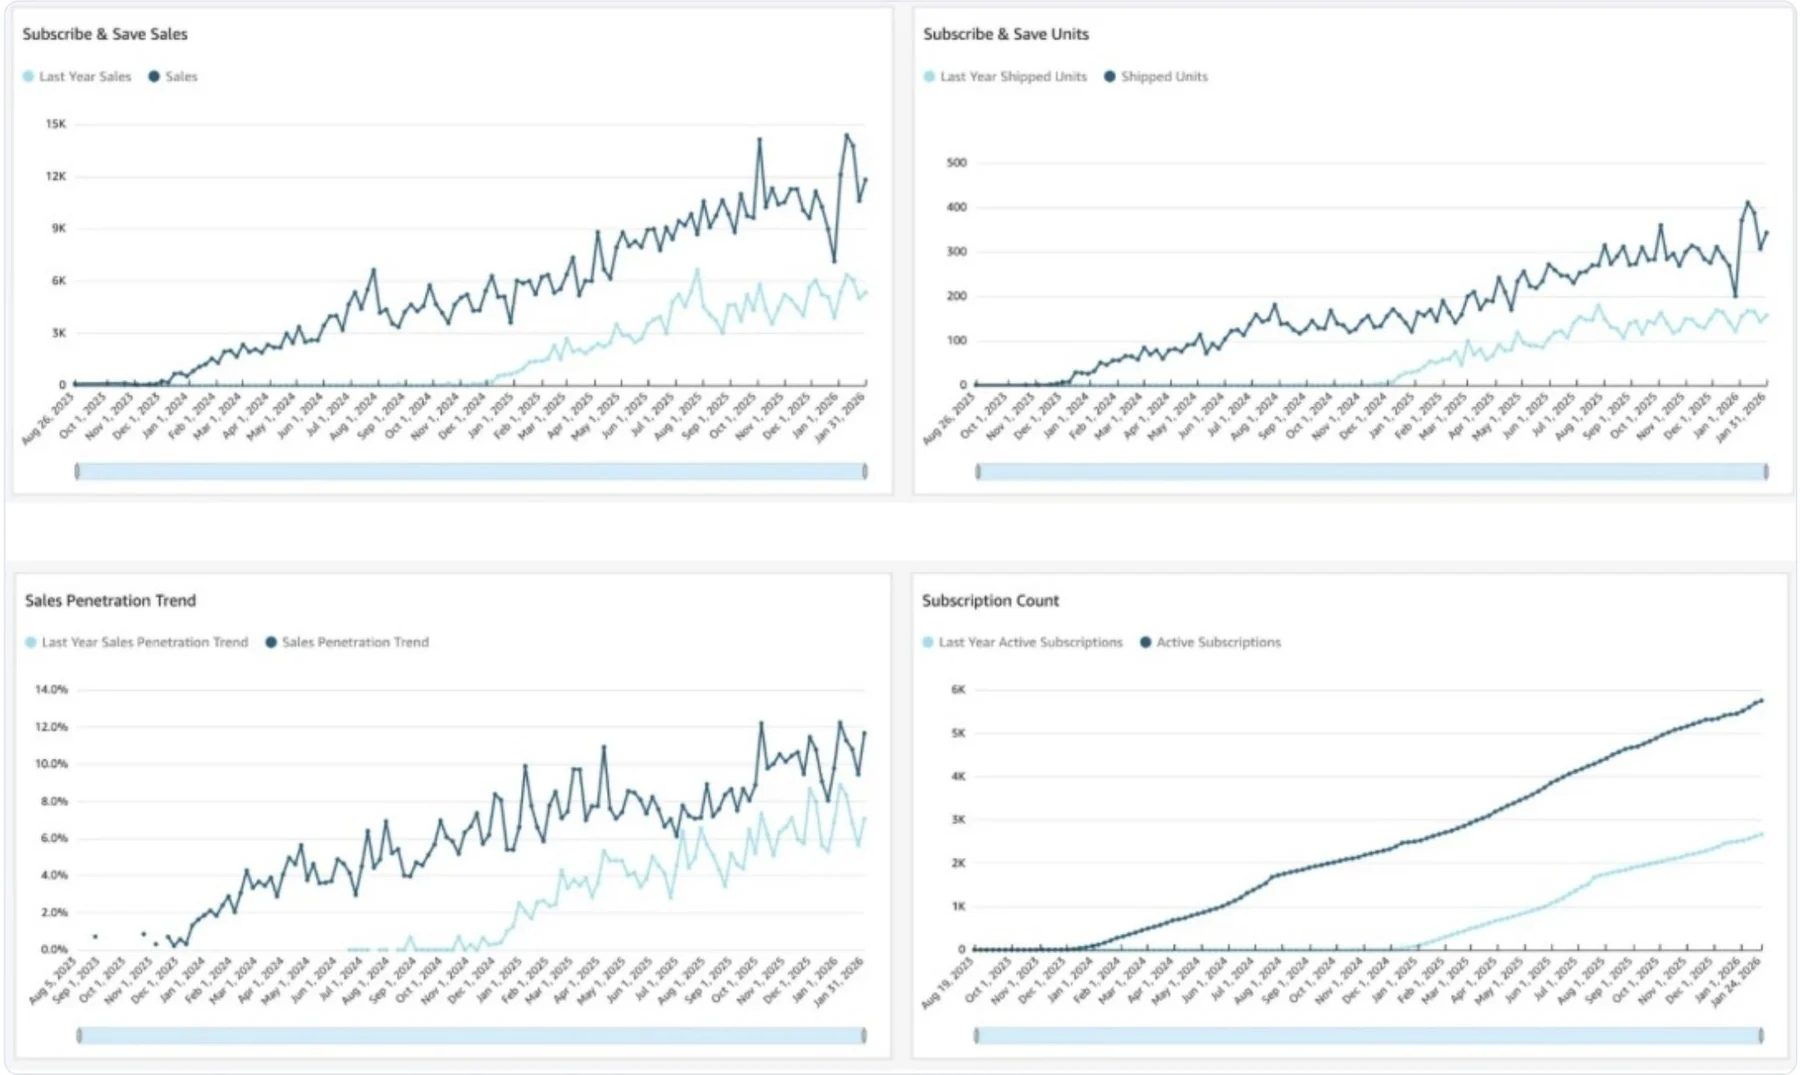
Brand names and account identities are not disclosed.
More case studies
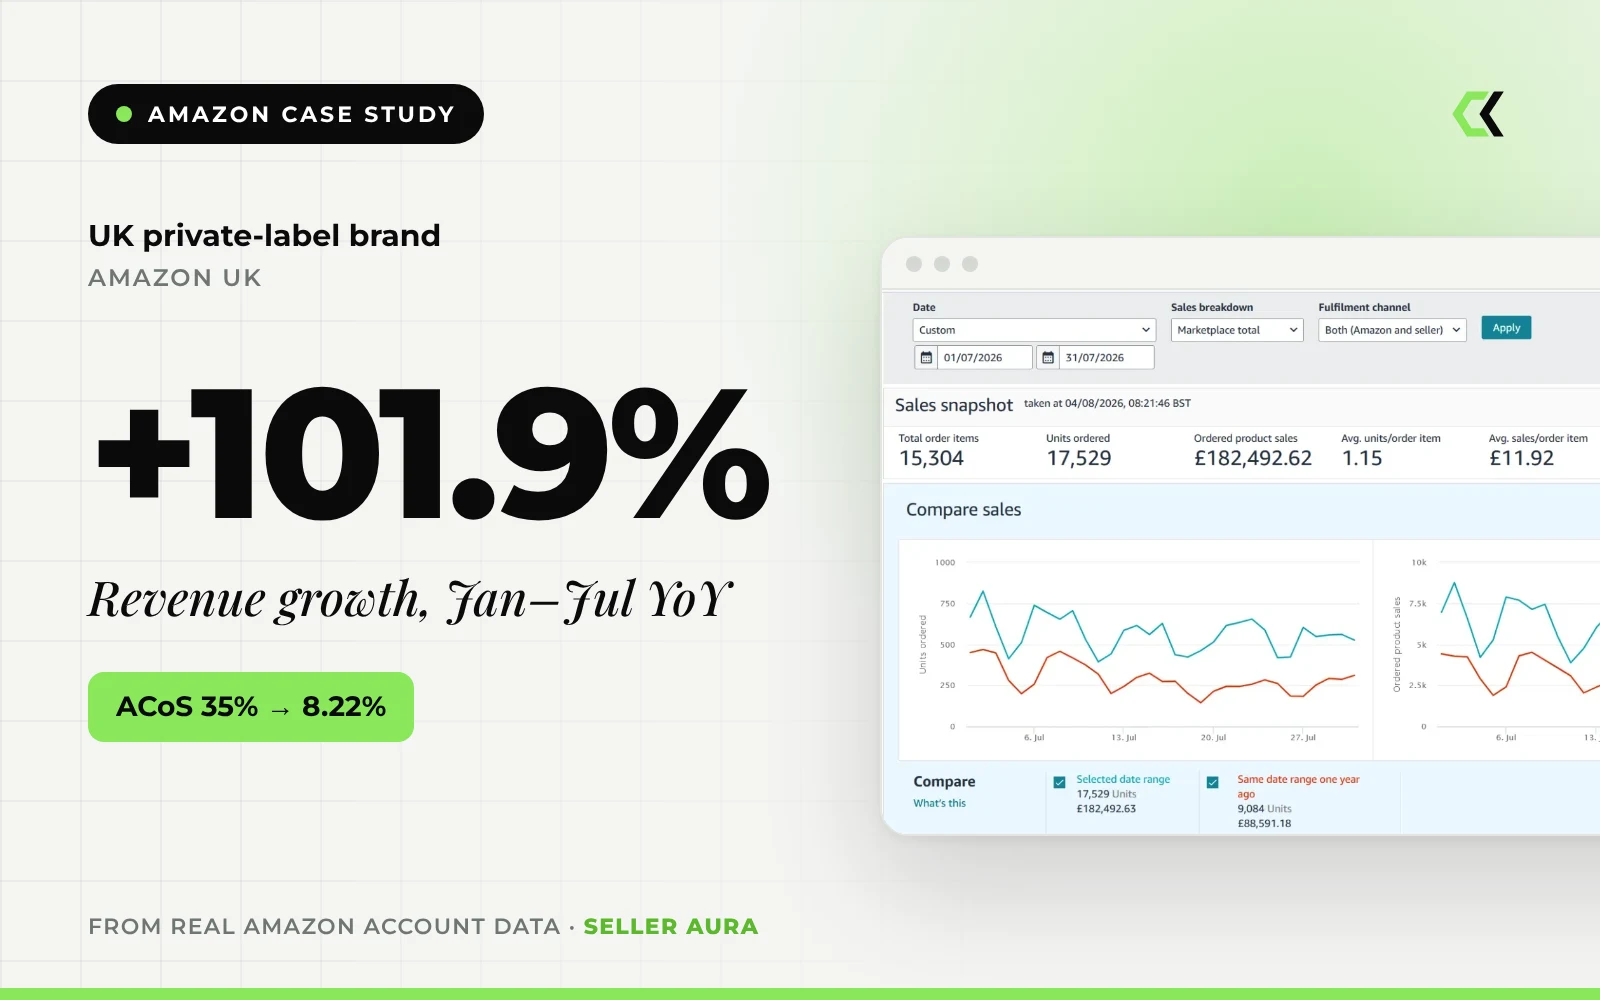
Year-to-date revenue growth for a UK private-label brand, while ACoS fell from about 35% to 8.22%
Read case study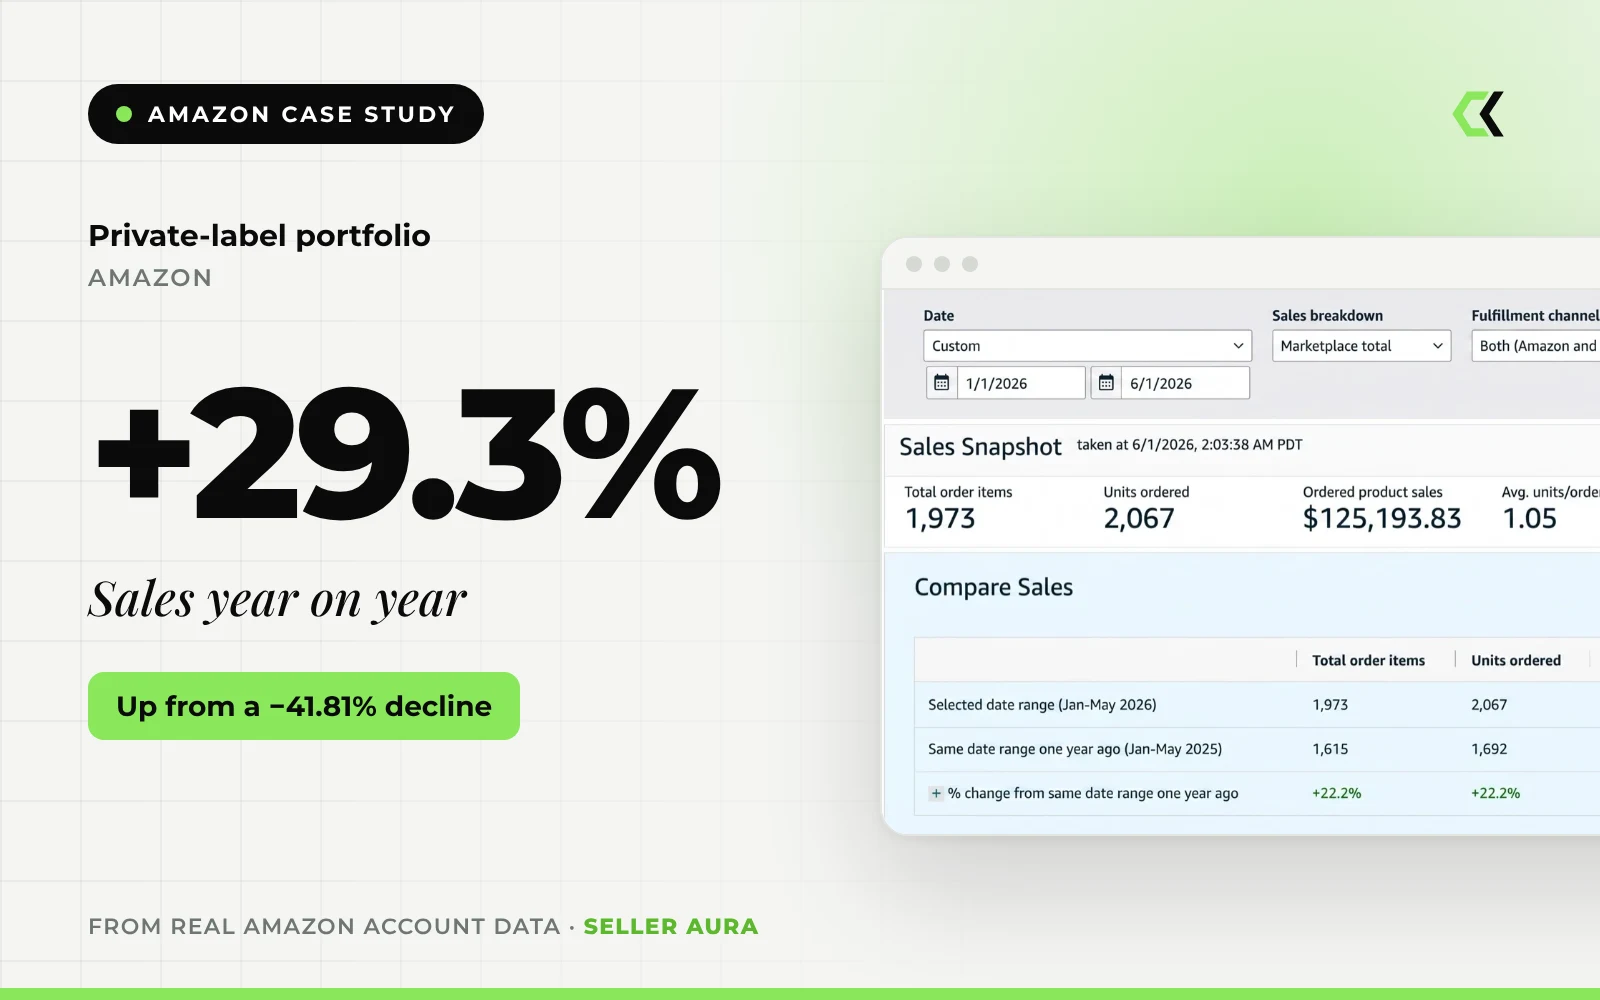
Year-on-year sales growth for a private-label portfolio that had been declining by 41.81%
Read case study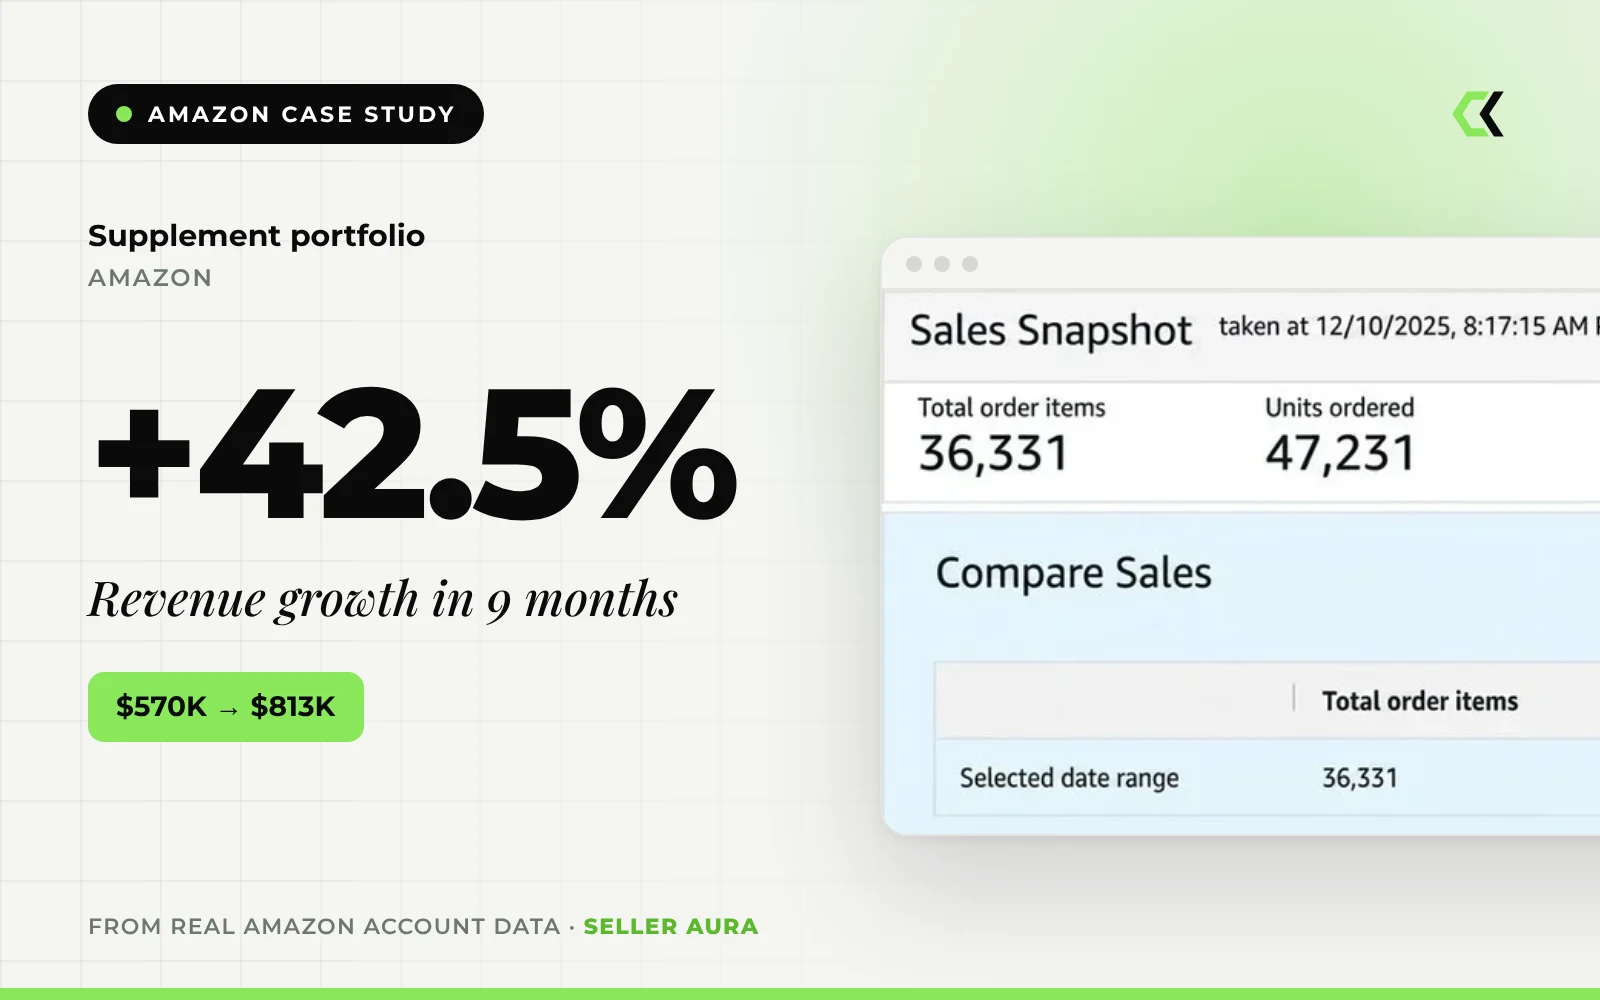
Revenue growth for a supplement portfolio, from $570K to $813K in a 9-month window
Read case studyWant results like these?
Tell us where you sell and what you want to achieve. We will come back with a clear, practical plan, free of charge.