
Amazon portfolio profitability turnaround
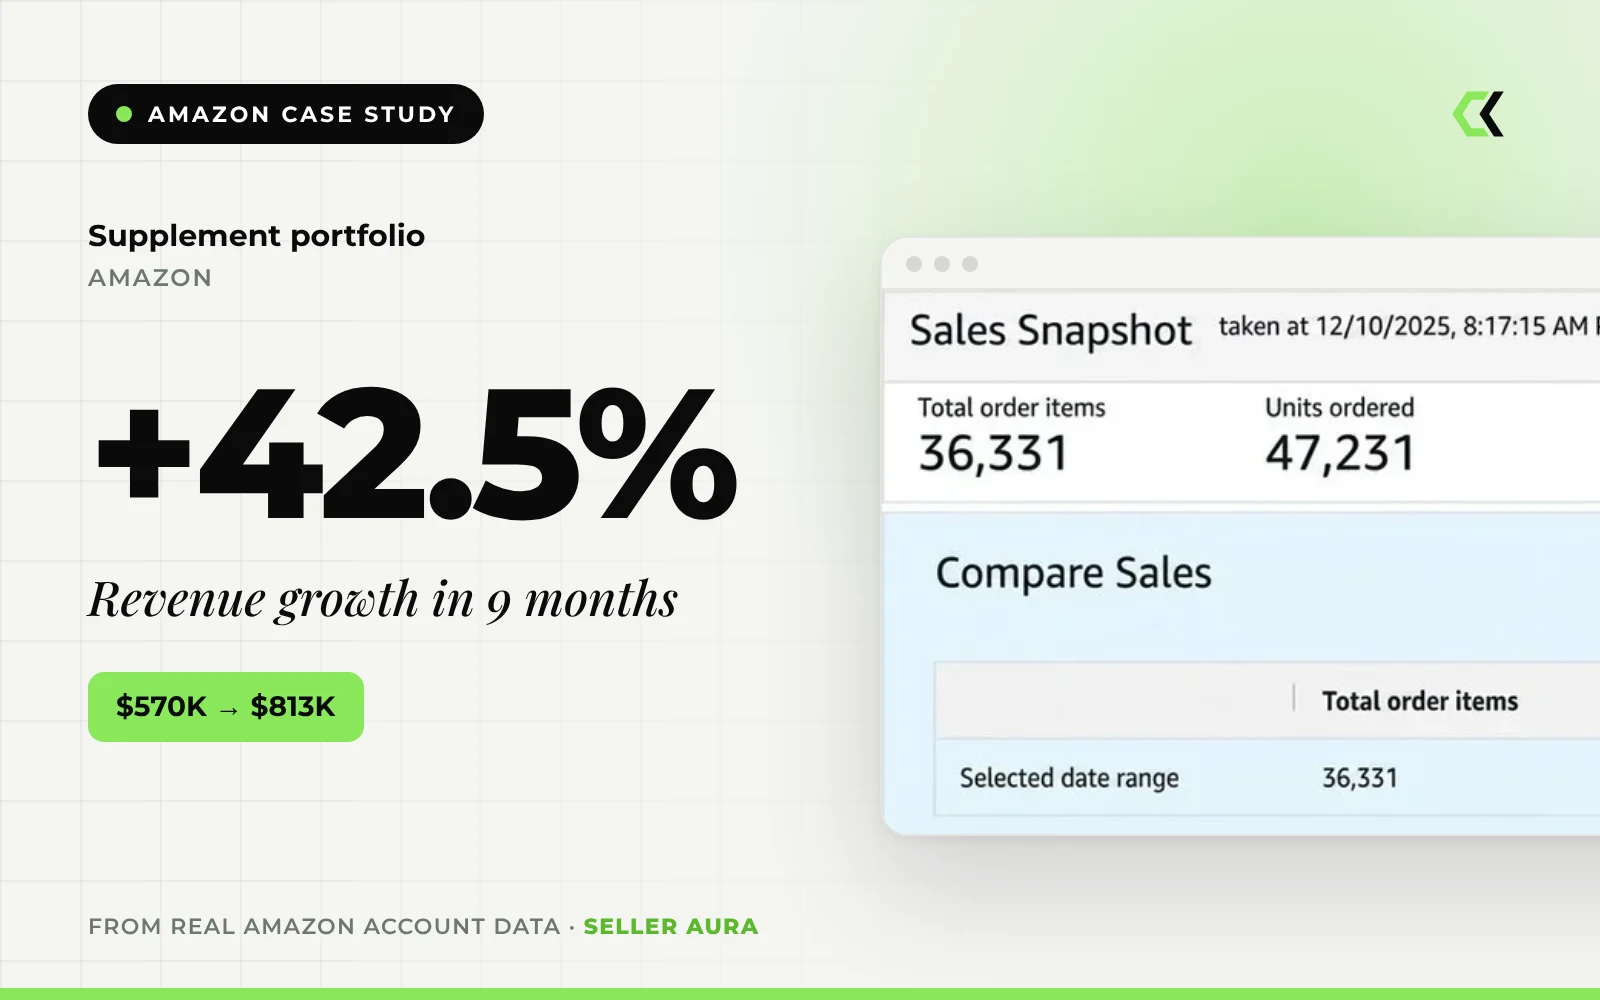
A supplement portfolio grew Amazon ordered product sales from $570K to $813K in a 9-month management window, while improving PPC control, order volume, average order value and operating visibility.
The account
The portfolio had real demand, but campaigns were not separated by intent, match type or product role, spend was spread too broadly and advertising decisions were not connected to margin or inventory.
Seller AURA rebuilt the growth system around campaign control, search-term discipline, conversion accountability and weekly KPI ownership.
What was holding growth back
Inefficient campaign architecture
Campaigns were not separated by intent, match type, product role or stage, which slowed budget decisions.
No budget priority framework
Spend was distributed too broadly instead of protecting core revenue drivers.
Low margin visibility
Ad decisions were not connected to unit margin, inventory exposure or contribution margin.
Reporting without ownership
There was no weekly rhythm connecting revenue, TACoS, conversion, inventory and action owners.
How Seller AURA approached it
Days 1–30: audit and control
Reviewed campaign structure, spend leakage, product roles, search terms and margin visibility.
Days 31–60: optimisation system
Rebuilt campaigns by intent, match type and product role, and prioritised budgets.
Days 61–90: scale and ownership
Moved budget into proven areas and tightened reporting for faster decisions.
Portfolio operating rhythm
Weekly reporting across revenue, ACoS, TACoS, contribution margin, inventory turn and cash flow.
What changed
| Metric | Before | After | Change |
|---|---|---|---|
| Ordered product sales | $570,306.90 | $812,951.44 | +42.5% |
| Units ordered | 34,108 | 47,231 | +38.5% |
| Total order items | 30,834 | 36,331 | +17.8% |
| Avg. sales per order item | $18.50 | $20.62 | +11.5% |
- $242,644.54 in additional ordered product sales.
- Order volume and order value improved together, so growth did not rely on a single lever.
Straight from the account
Unedited screenshots from Amazon Seller Central, the Advertising Console and the account's reporting tools, with date ranges left visible.
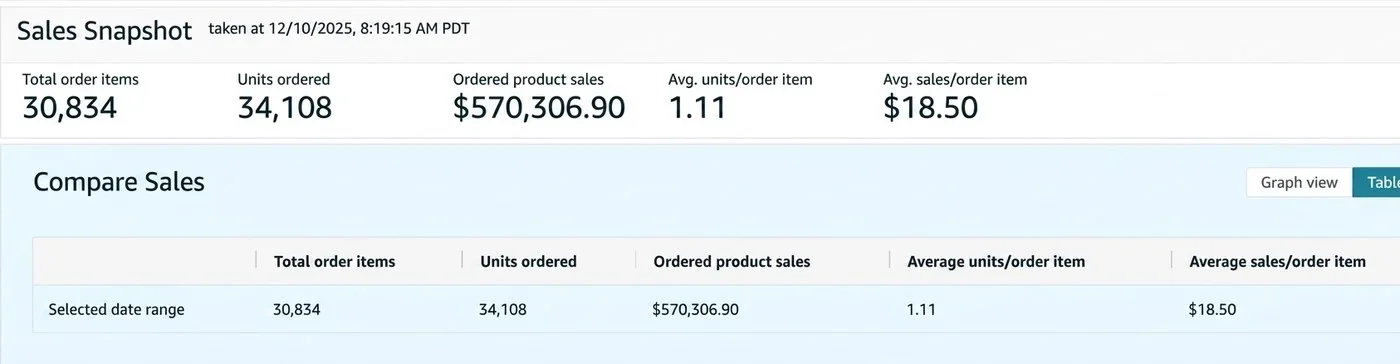
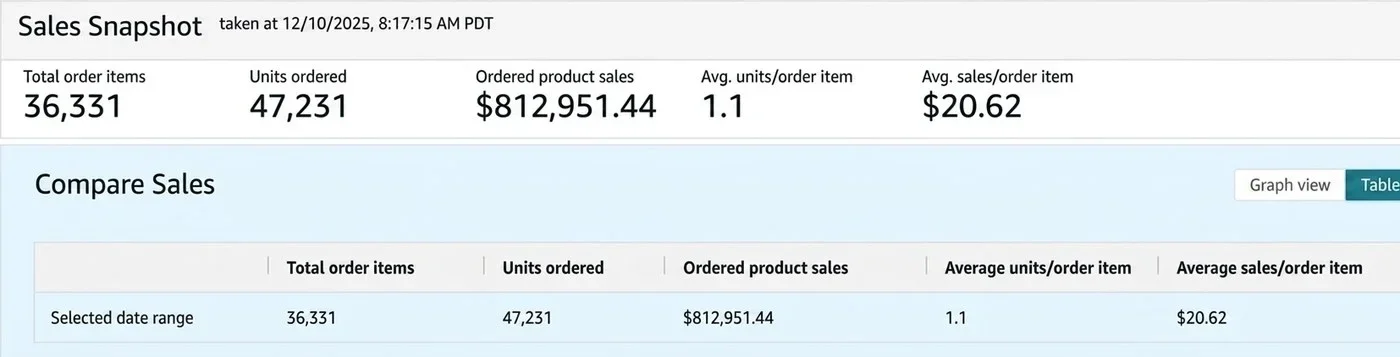
Screenshots are cropped so no client, store, product, ASIN or seller identity is shown. The category is generalised as a supplement portfolio.
More case studies
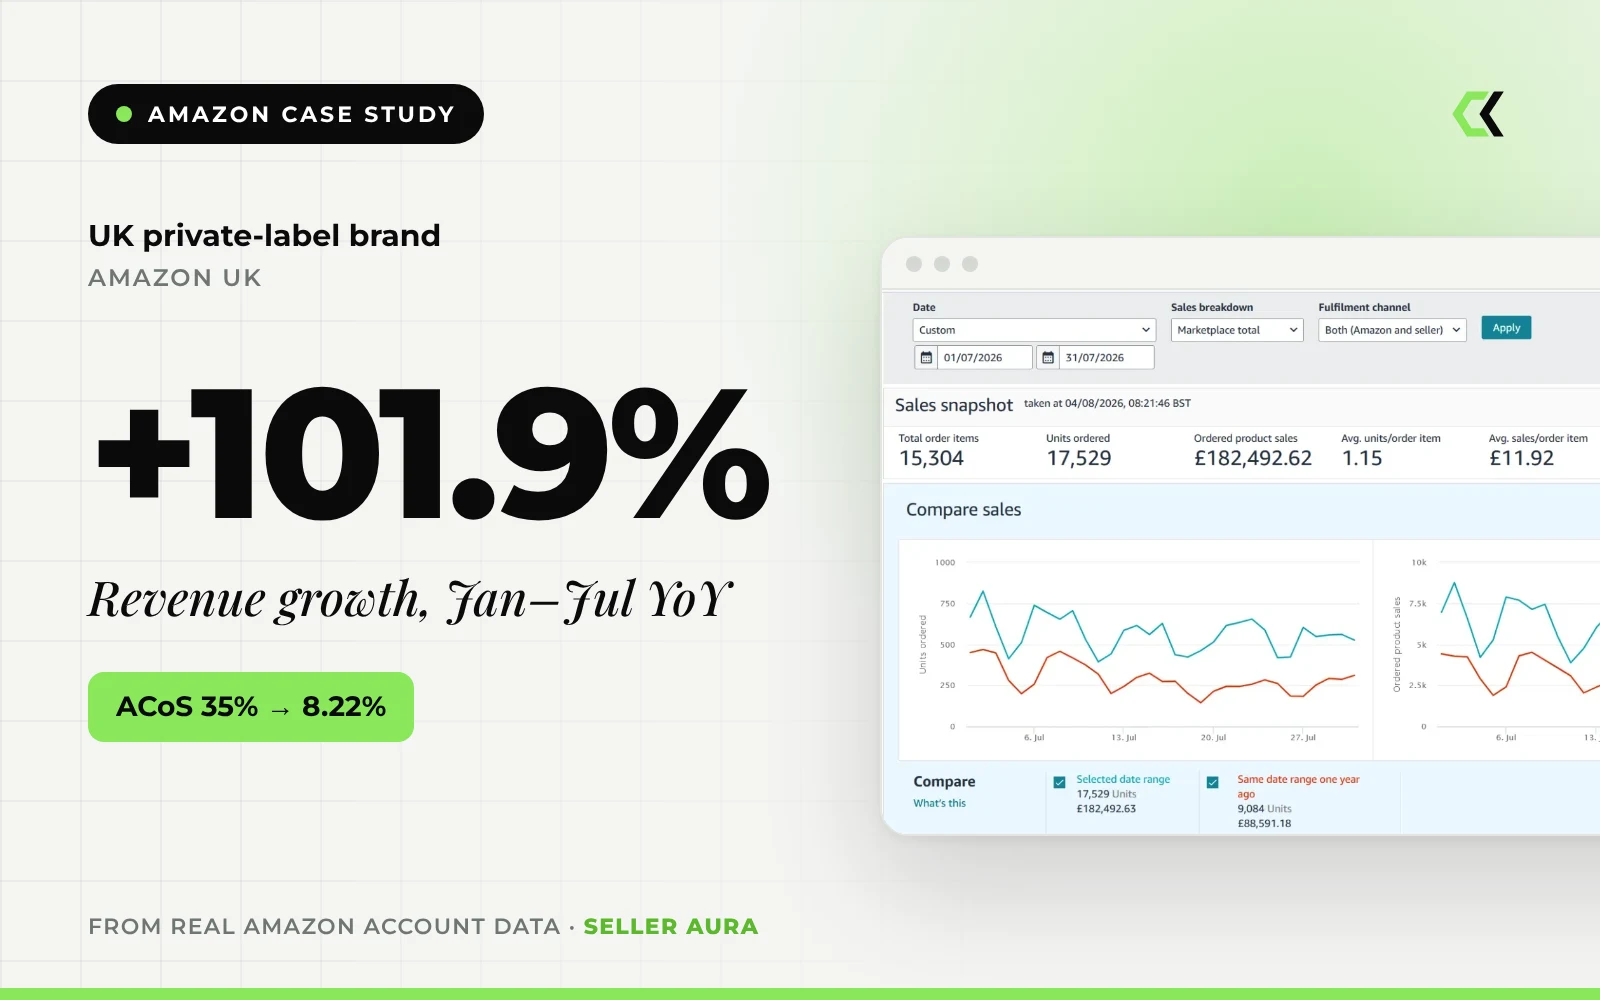
Year-to-date revenue growth for a UK private-label brand, while ACoS fell from about 35% to 8.22%
Read case study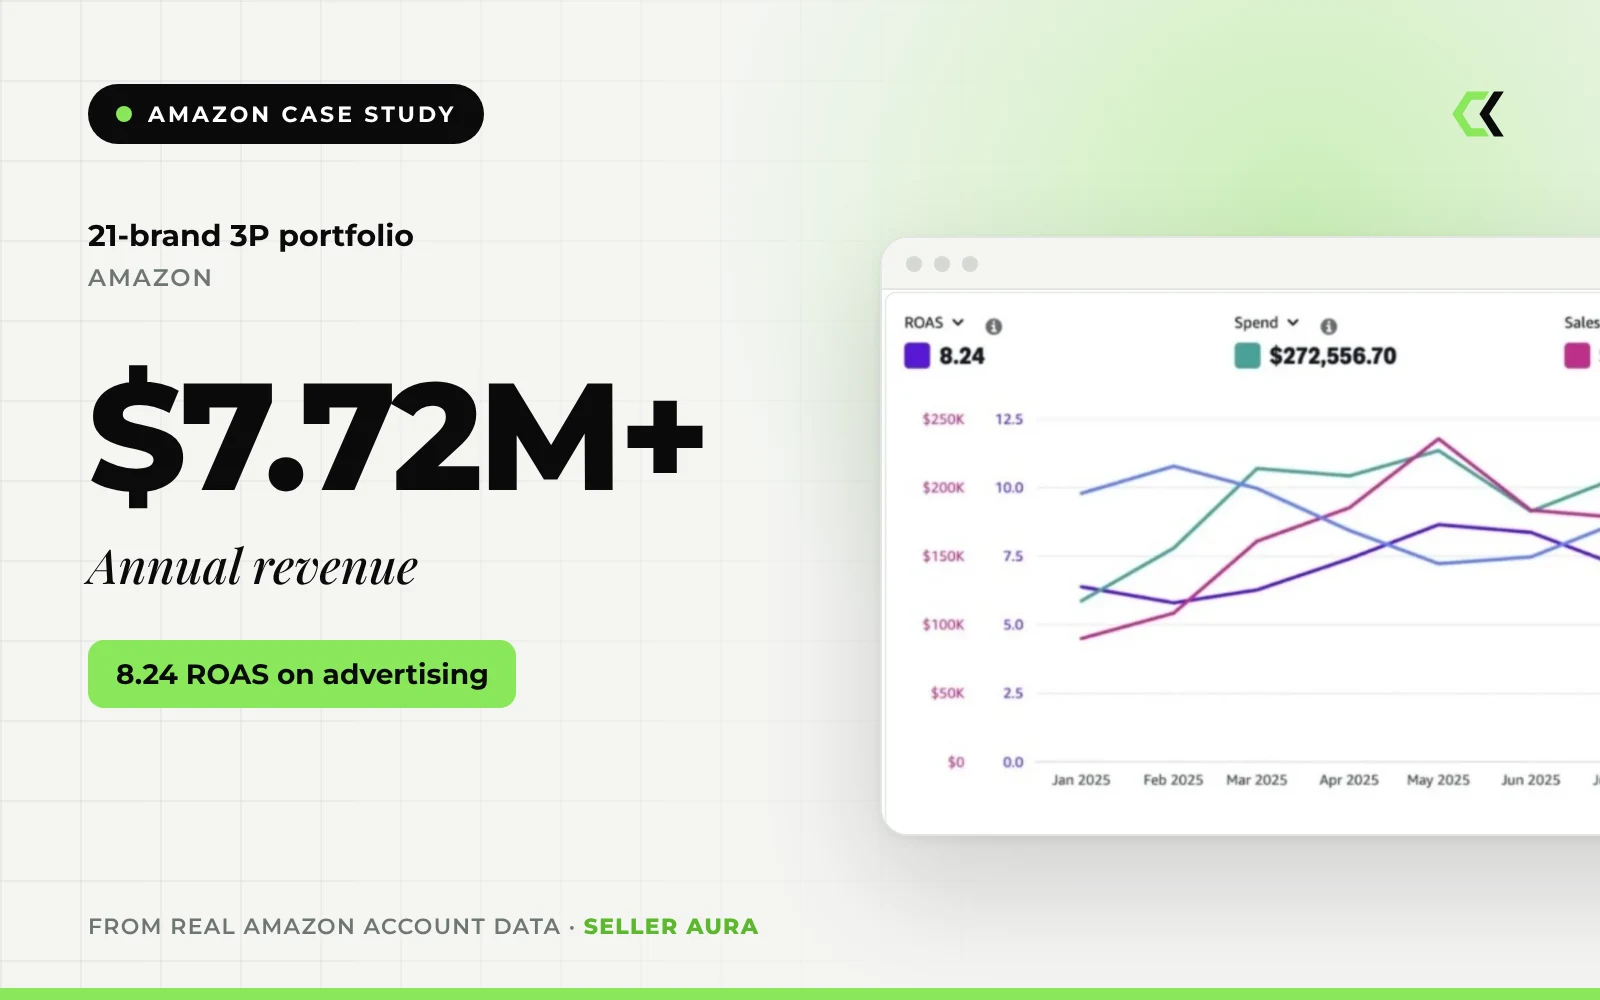
Annual revenue across a 21-brand Amazon 3P portfolio, with advertising at 8.24 ROAS
Read case study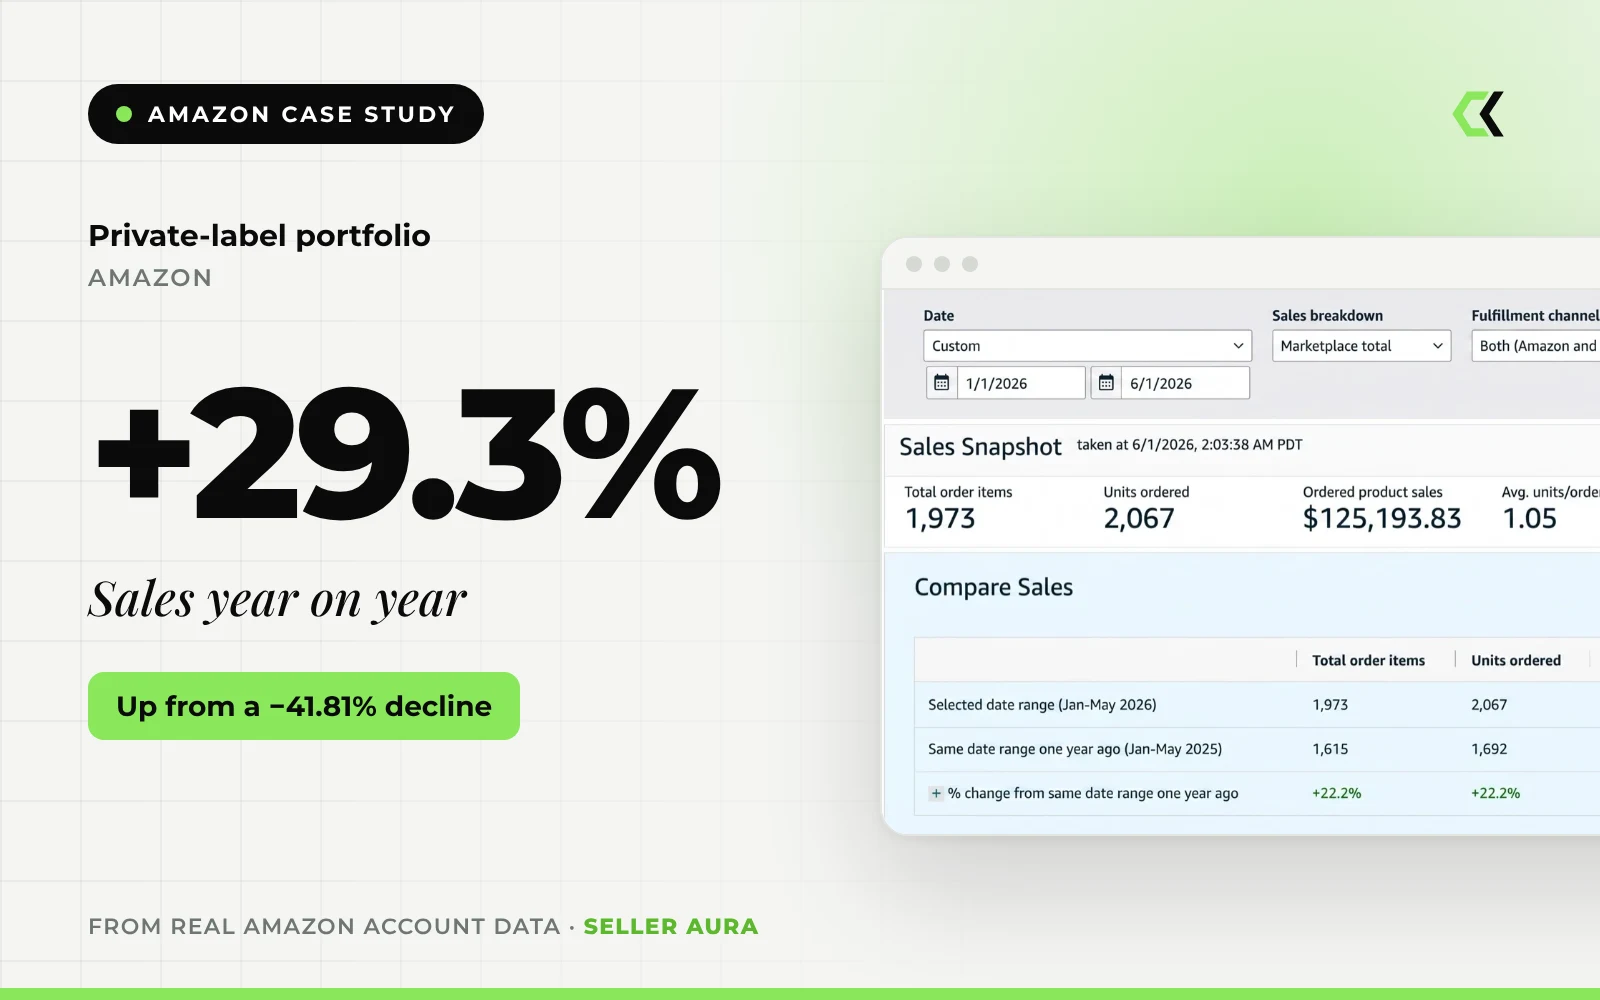
Year-on-year sales growth for a private-label portfolio that had been declining by 41.81%
Read case studyWant results like these?
Tell us where you sell and what you want to achieve. We will come back with a clear, practical plan, free of charge.