
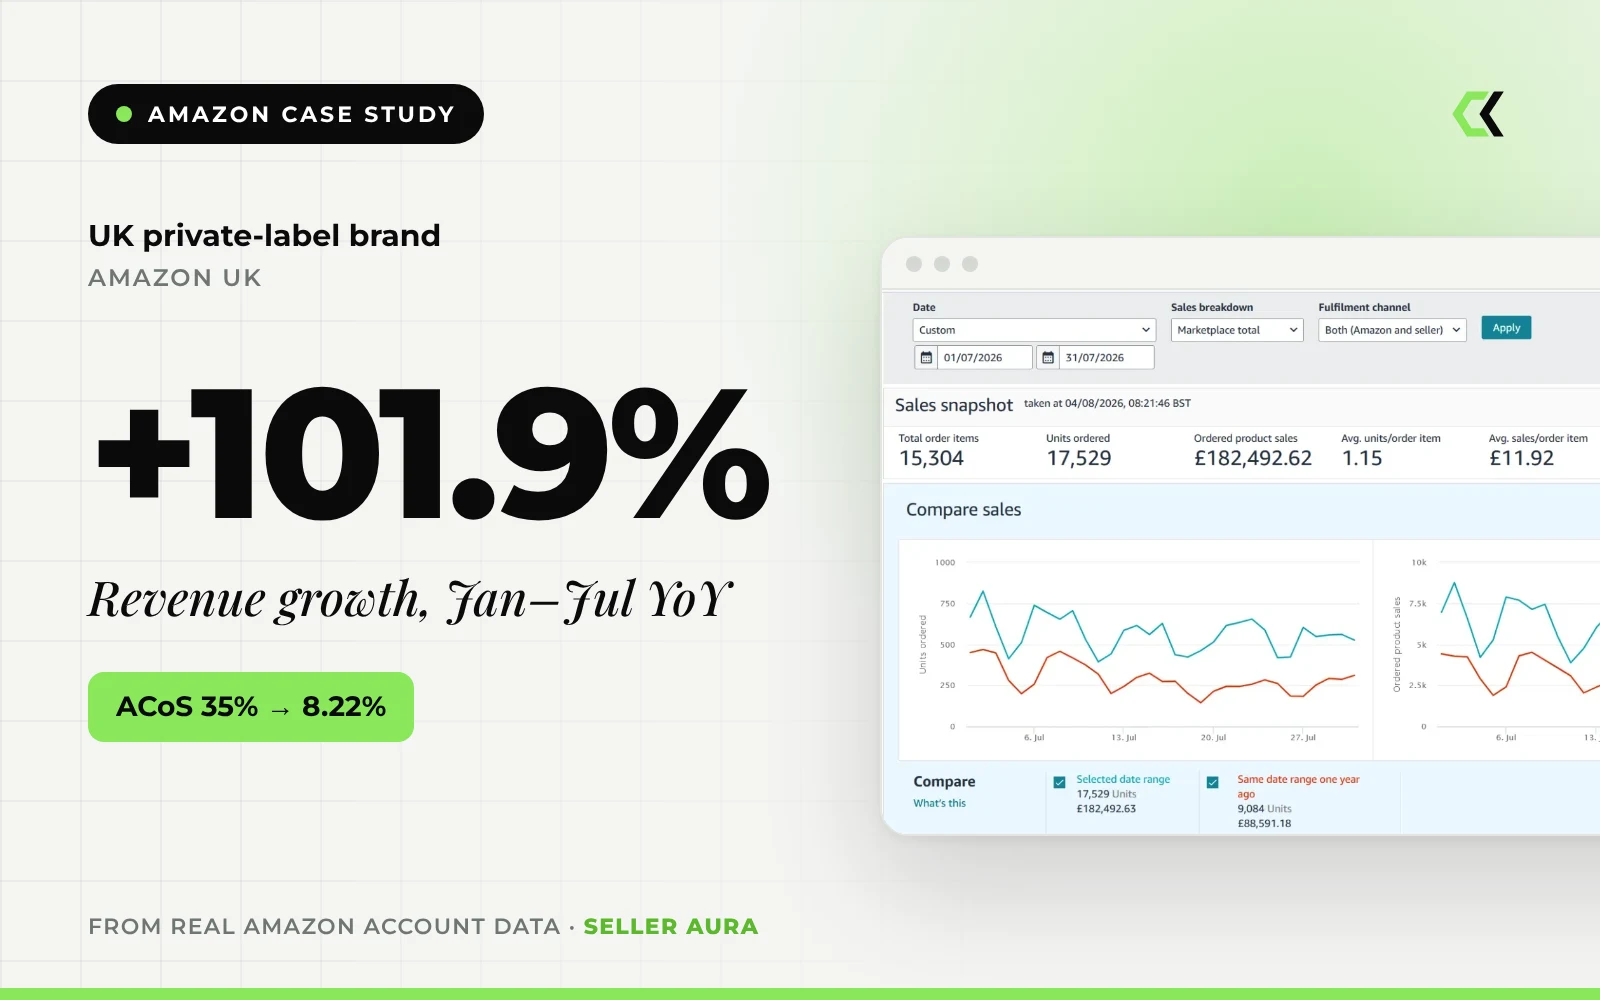
From 35% ACoS to single digits, while revenue more than doubled
A UK private-label account that was running at roughly 35% ACoS, with every push for growth driving advertising cost higher. The brief was to bring advertising cost down to a durable level and scale revenue at the same time.
The account
This is a single UK private-label account managed by Seller AURA under a continuous engagement. When we took it on, the account was running at roughly a 35% ACoS, and growth and efficiency were working against each other.
The engagement had four objectives: lower ACoS to a durable level, scale revenue at the same time, replace ad-hoc bidding with a campaign architecture that can be governed weekly, and back every result with dated Seller Central and Advertising Console screenshots.
What was holding growth back
Unpredictable advertising cost
ACoS sat at around 35%, with no stable level the business could plan around.
Growth and efficiency in conflict
Every push for more revenue raised the cost of advertising, rather than the two improving together.
Ad-hoc bidding
There was no campaign architecture that could scale cleanly or be reviewed on a weekly rhythm.
How Seller AURA approached it
Traffic separated by intent
Brand defence, generic growth, competitor traffic and discovery were split out, so each stopped sharing one blended target.
Query-led keyword strategy
First-party search query data was used to connect paid visibility, organic position and real purchase behaviour.
Weekly search-term review
Wasted spend was contained quickly, and proven converting queries were moved into controlled exact-match structures.
Targets set by product economics
Campaigns were judged against what each product could afford, rather than one blanket ACoS target.
Ads and listings aligned
Converting queries informed listing relevance, copy priorities and creative direction, so paid traffic landed on stronger pages.
Paid and total sales read together
ACoS, TACoS, CPC, ad sales and Seller Central revenue were reviewed in one operating rhythm.
What changed
| Month (2026) | Ad spend | Ad sales | CPC | ACoS |
|---|---|---|---|---|
| March | £3,617.73 | £30,855.57 | £0.64 | 11.72% |
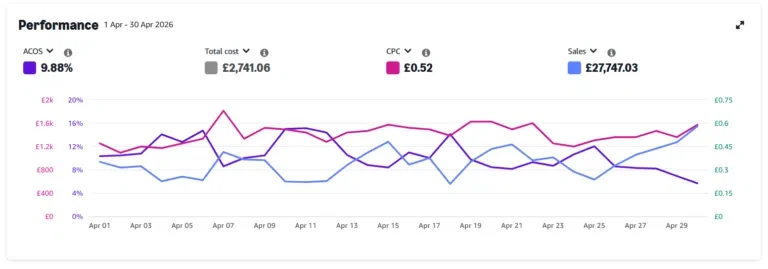
| April | £2,741.06 | £27,747.03 | £0.52 | 9.88% |
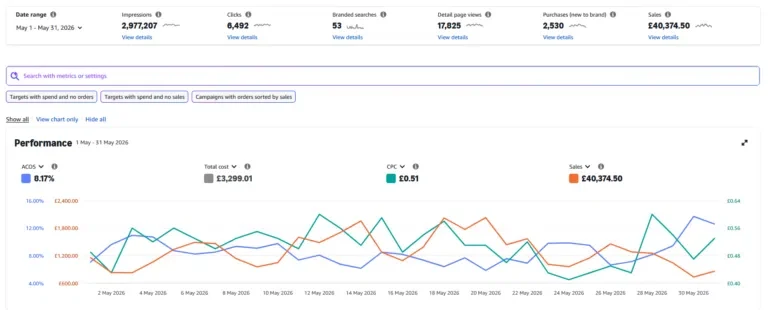
| May | £3,299.01 | £40,374.50 | £0.51 | 8.17% |
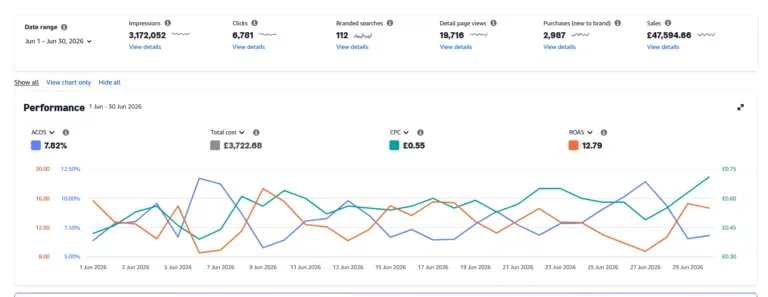
| June | £3,722.88 | £47,594.66 | £0.55 | 7.82% |
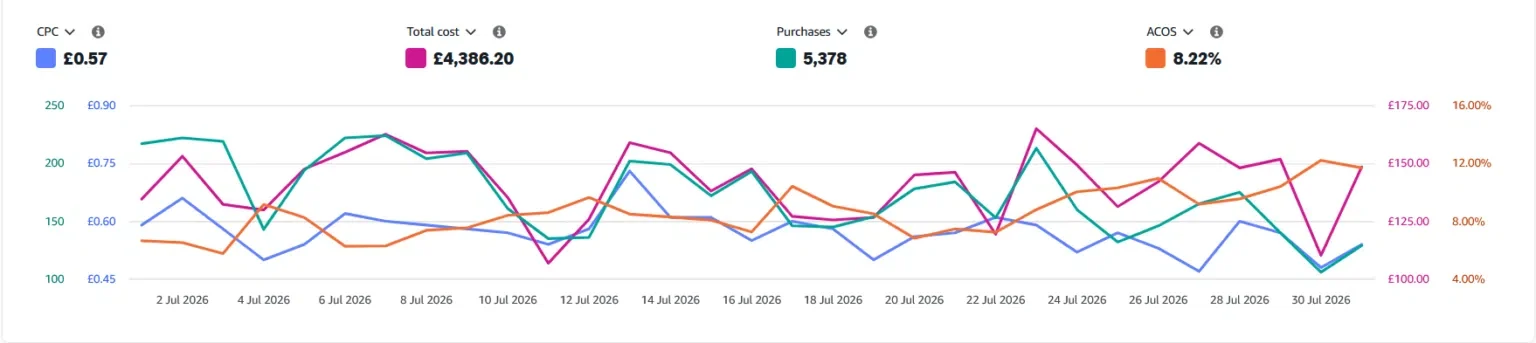
| July | £4,386.20 | — | £0.57 | 8.22% |
- ACoS held below 10% for four consecutive months, April to July 2026: 9.88%, 8.17%, 7.82% and 8.22%.
- Ordered product sales for January to July 2026 reached £908,949.87, against £450,172.22 for the same period in 2025.
- July 2026 delivered £182,492.62 in ordered product sales, up 106% on July 2025 (£88,591.18).
- The best ROAS of the period, 12.79x, was recorded in June 2026.
Straight from the account
Unedited screenshots from Amazon Seller Central, the Advertising Console and the account's reporting tools, with date ranges left visible.
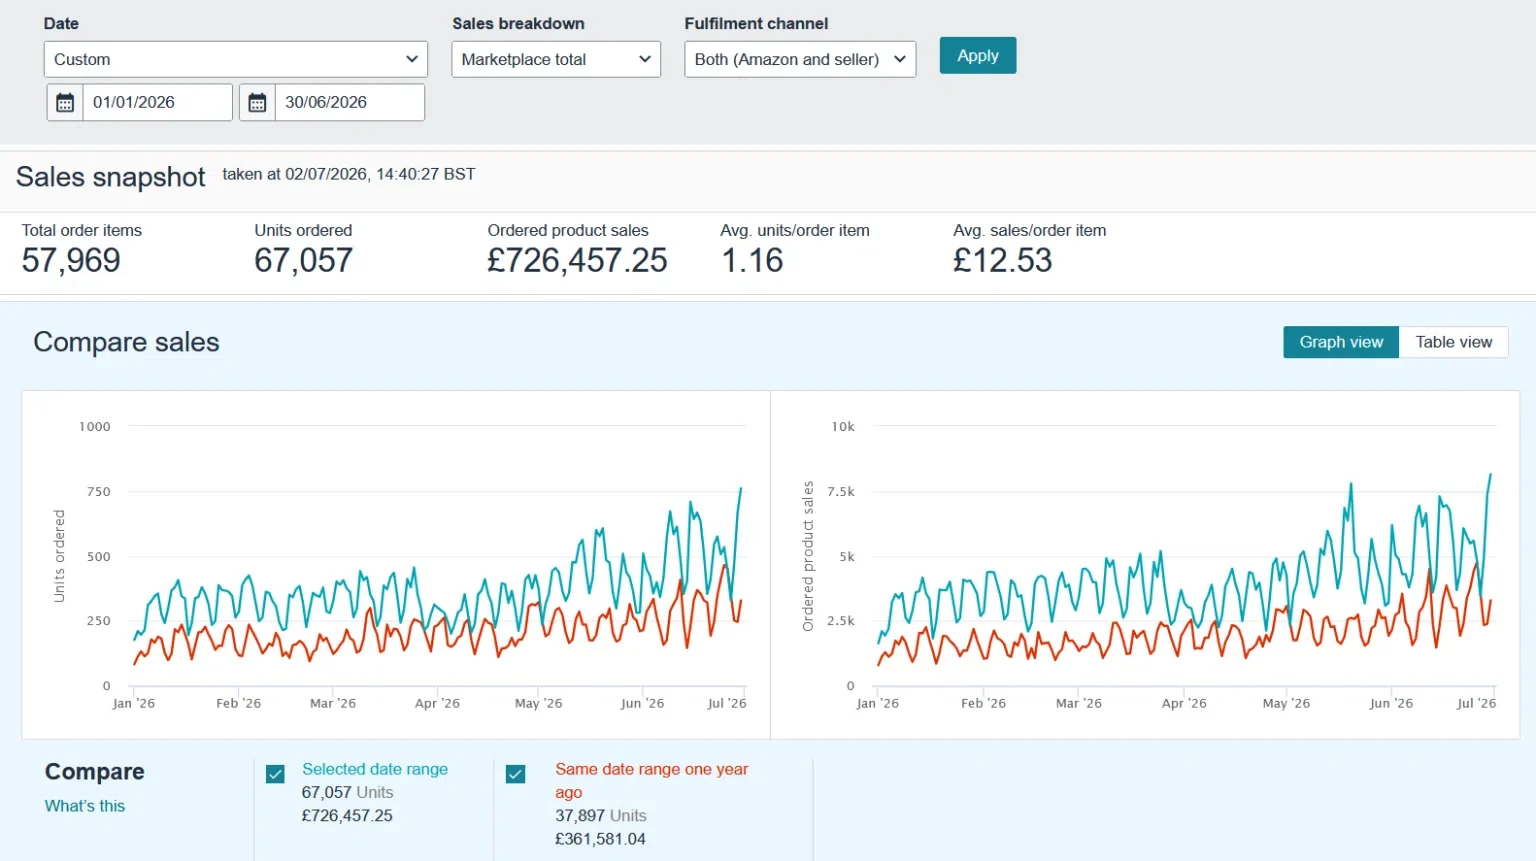
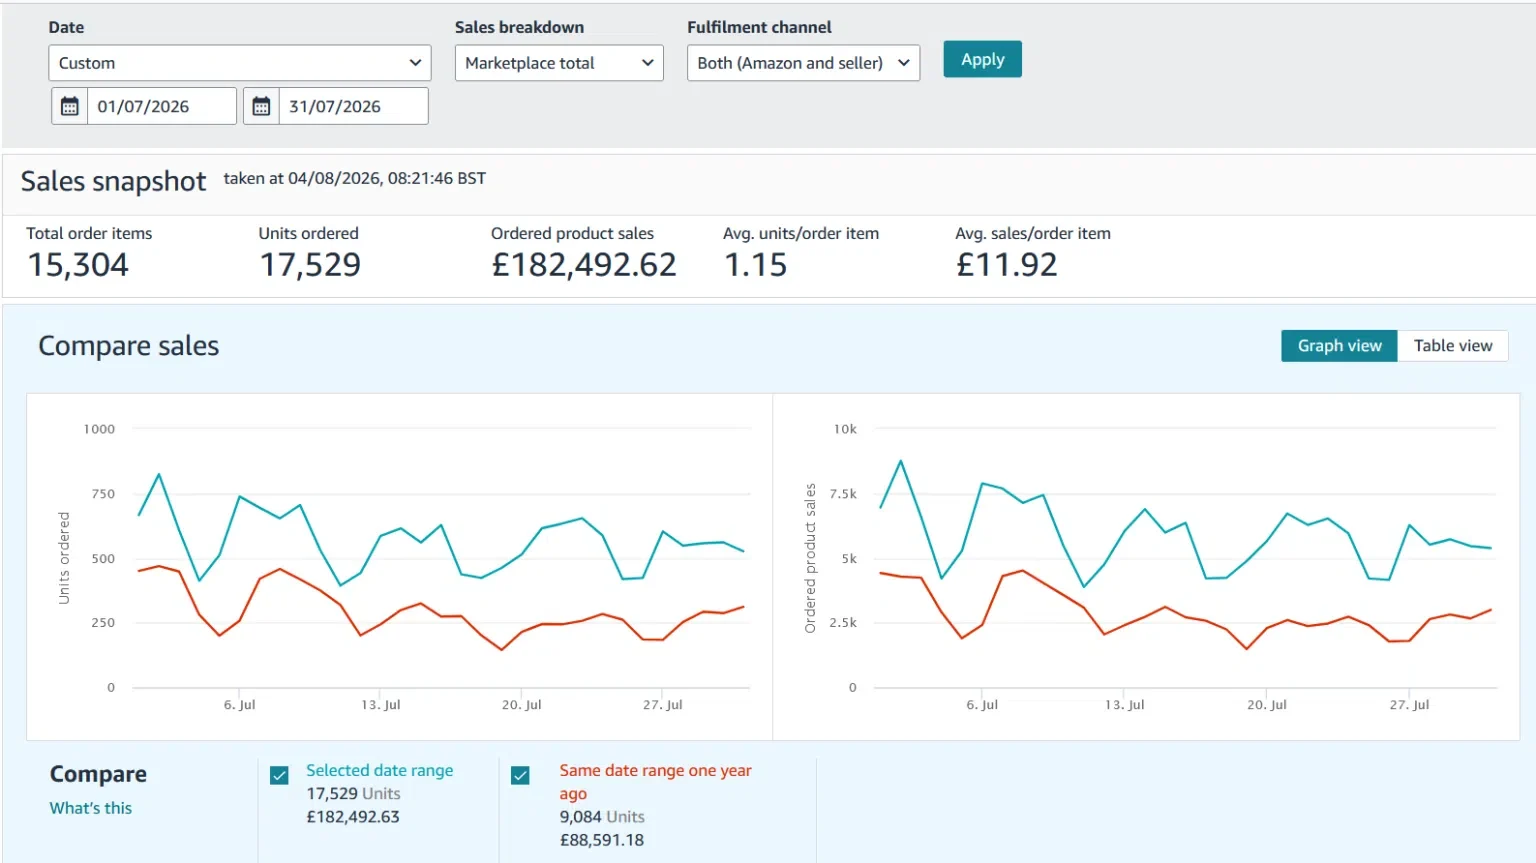
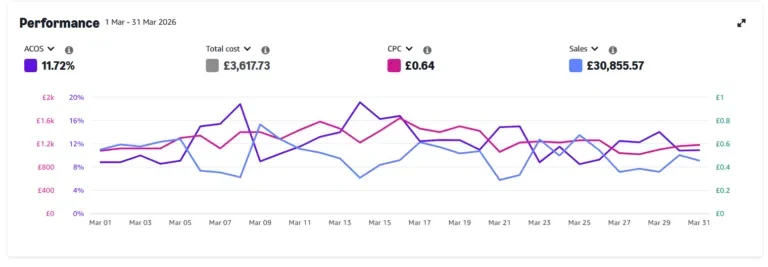
The account is managed under NDA, so the brand, ASINs and other identifying details are not published. All figures relate to this one account and are not blended with other clients. Results depend on product economics, reviews, inventory, competition and pricing, and are not guaranteed for another brand.
More case studies
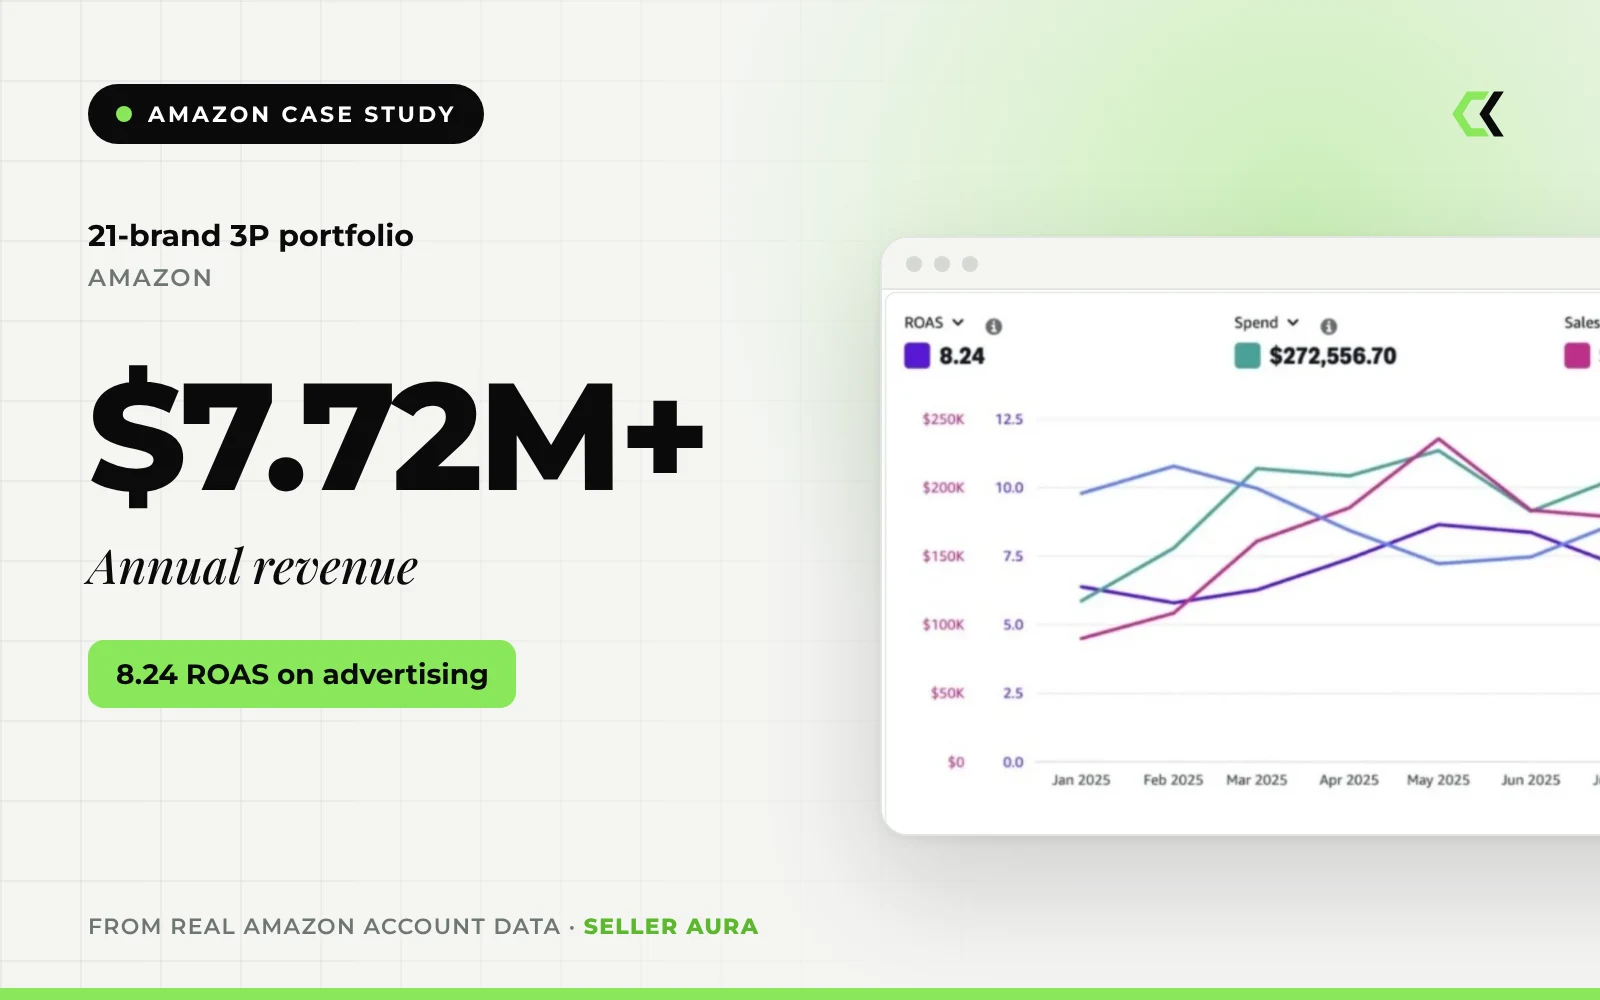
Annual revenue across a 21-brand Amazon 3P portfolio, with advertising at 8.24 ROAS
Read case study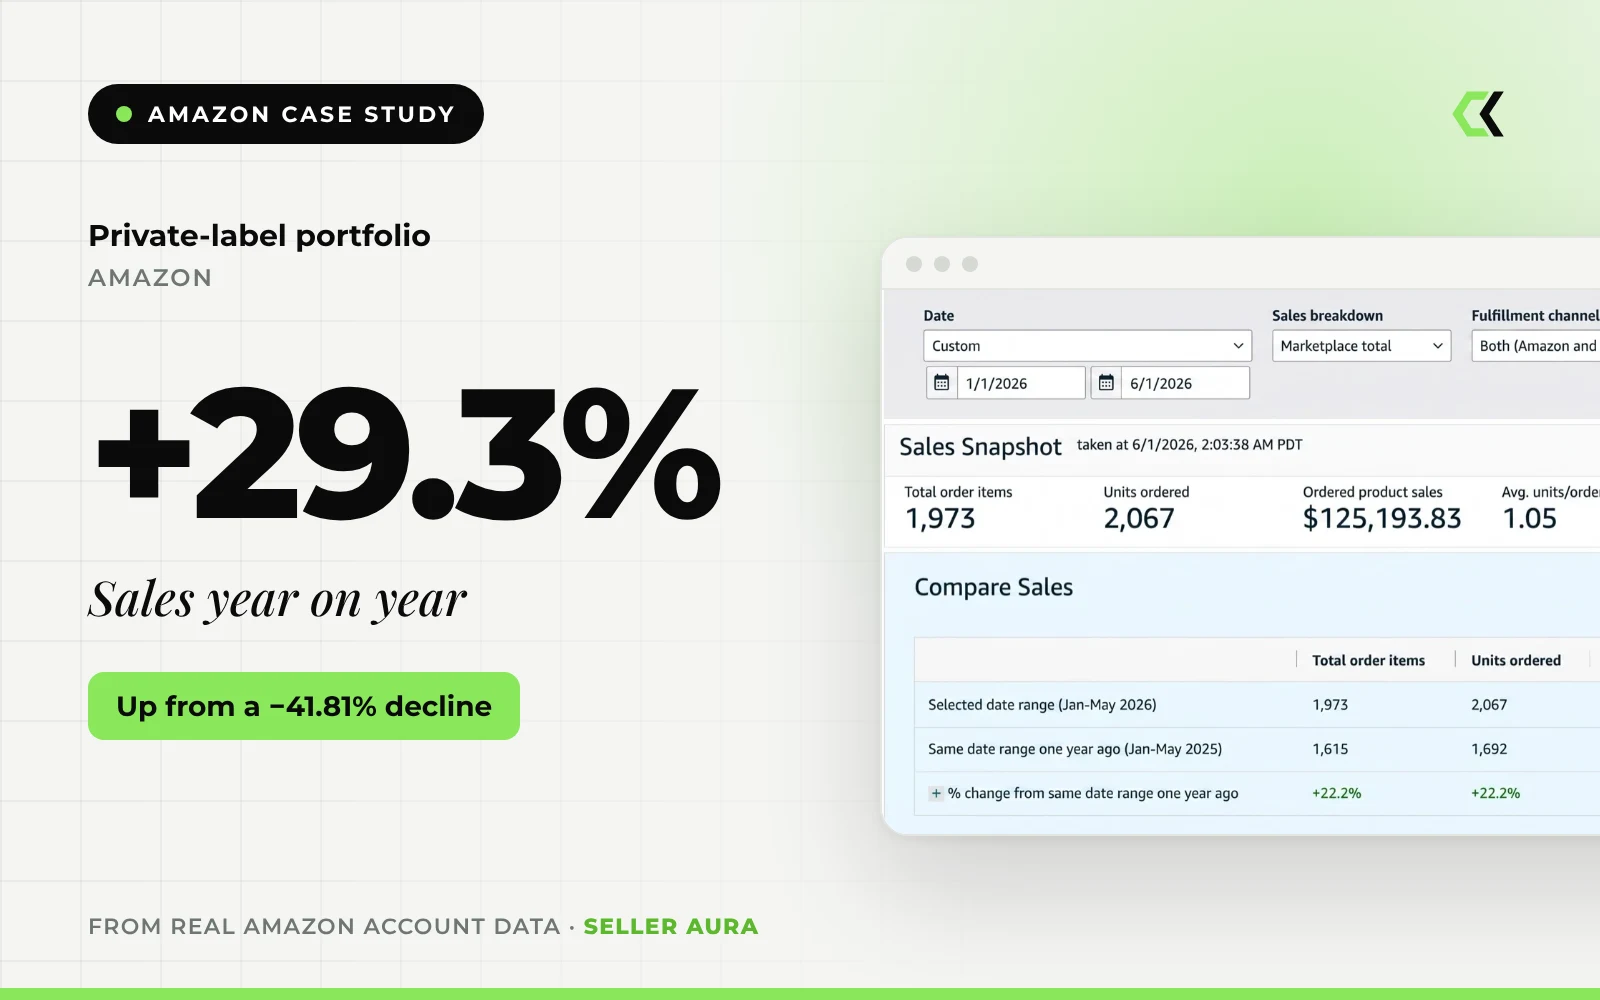
Year-on-year sales growth for a private-label portfolio that had been declining by 41.81%
Read case study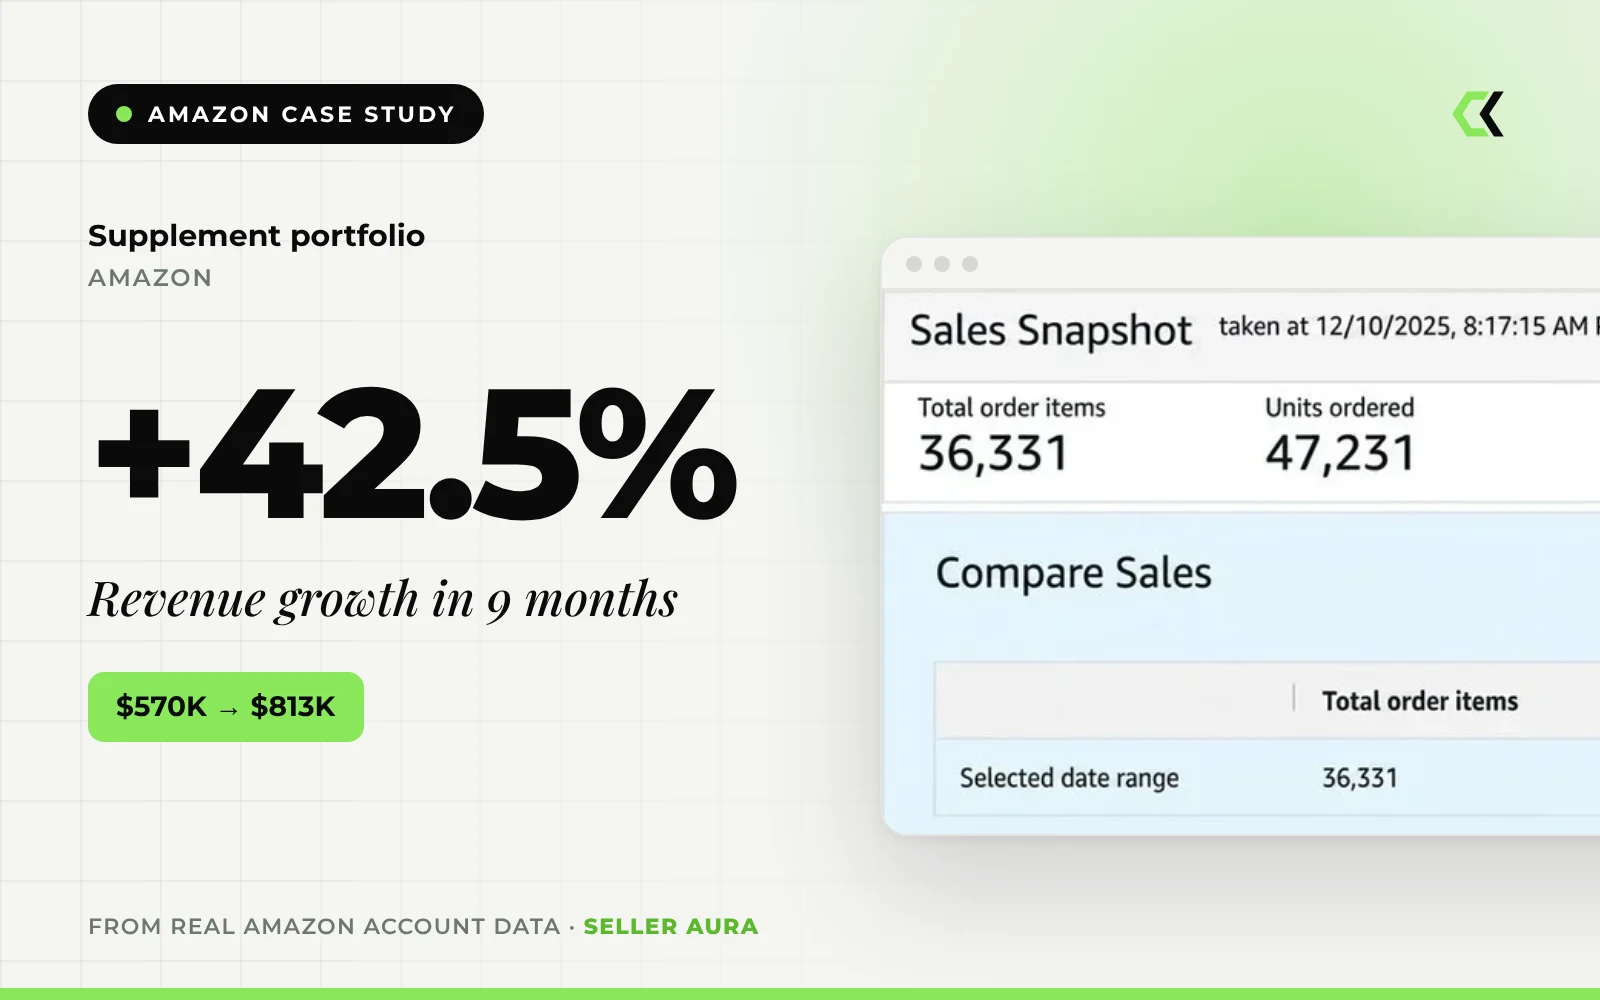
Revenue growth for a supplement portfolio, from $570K to $813K in a 9-month window
Read case studyWant results like these?
Tell us where you sell and what you want to achieve. We will come back with a clear, practical plan, free of charge.