
Amazon year-to-date sales and PPC recovery
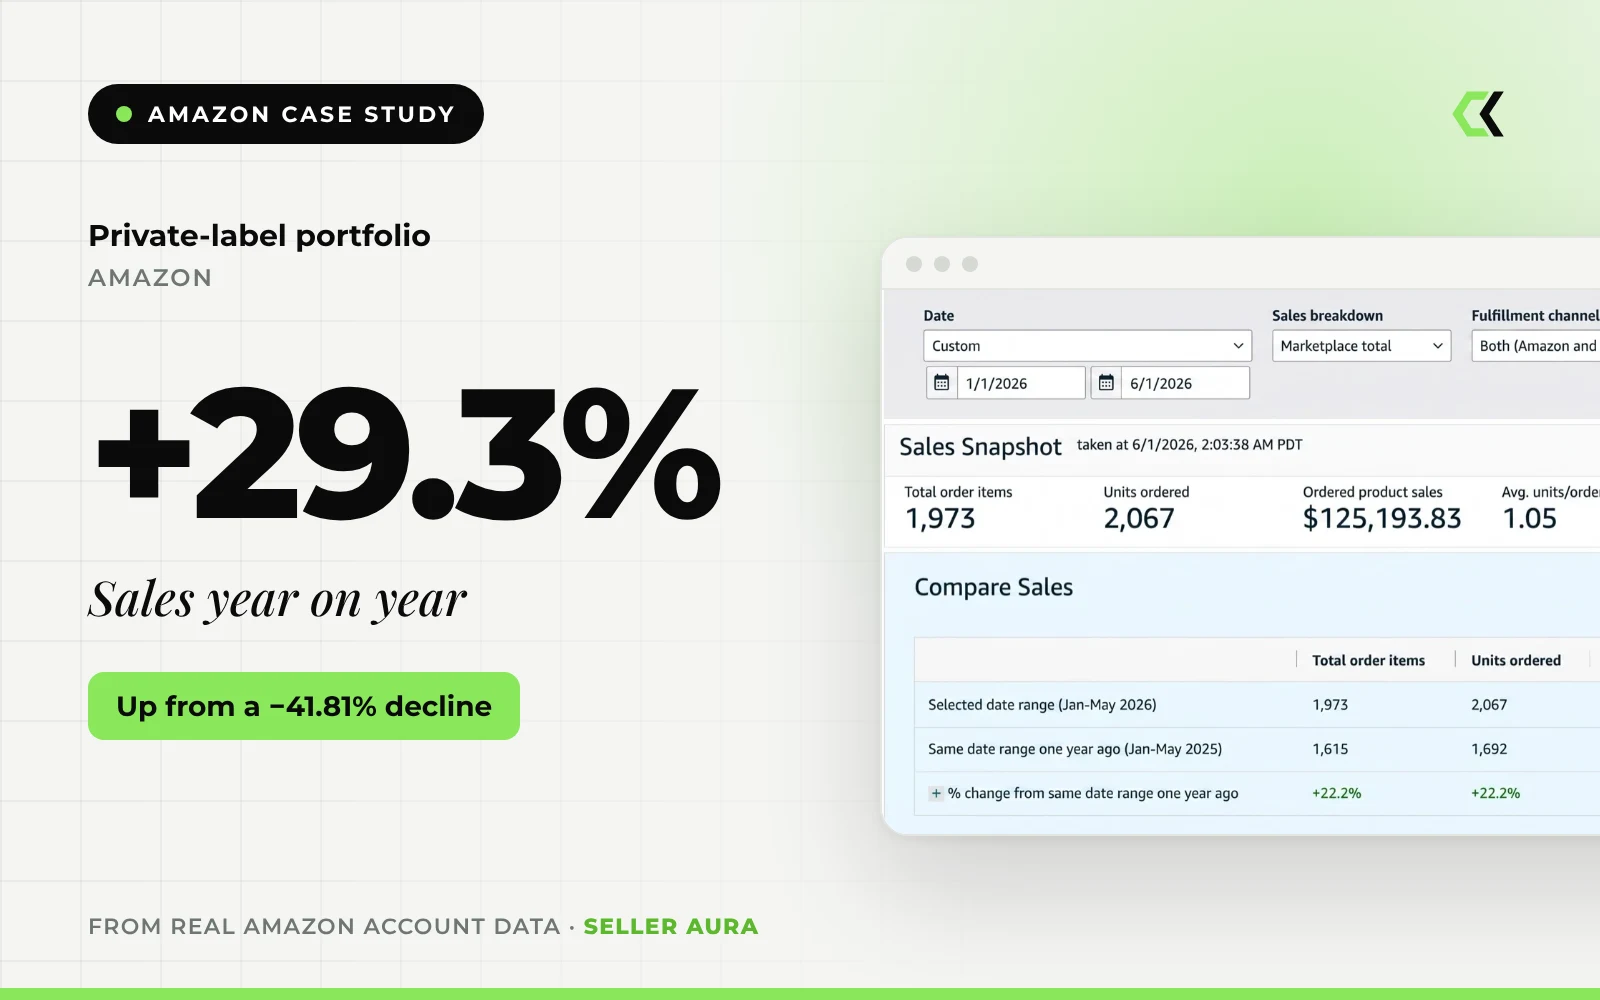
A private-label Amazon portfolio moved from a late-2025 decline into 2026 year-to-date growth after Seller AURA rebuilt PPC control, tightened spend priorities and introduced weekly KPI ownership.
The account
Before Seller AURA began work, the account had a weak late-2025 comparison period: ordered product sales, units and order items were all down against the previous year.
Seller AURA started management at the beginning of 2026 and rebuilt the account around PPC discipline, weekly KPI ownership and clearer budget allocation. By the 2026 year-to-date view, the account had moved into positive growth.
What was holding growth back
Late-2025 sales softness
Ordered product sales, units and order items were all down year on year.
PPC needed clearer control
Spend was not separated by intent, campaign role or stage, so budget could not follow the strongest search terms.
No priority framework
There was no simple way to decide which products deserved budget protection and which should be tested cautiously.
Reporting was not action-led
Dashboards were treated as static reports rather than a weekly basis for decisions.
How Seller AURA approached it
Month 1: audit and control
Reviewed sales trends, campaign structure, budget leaks, product roles and reporting gaps to set a clear baseline.
Months 2–3: PPC rebuild
Reorganised campaigns by intent and product role, harvested converting terms and reduced waste.
Months 4–5: scale with visibility
Moved budget into validated areas while watching AOV, units, ACoS and total sales.
Weekly KPI ownership
Sales, units, AOV, ad spend, ACoS and conversion inputs reviewed every week, so decisions happened faster.
What changed
| Period | Order items | Units | Ordered product sales | Change YoY |
|---|---|---|---|---|
| Aug – Dec 2025 (before) | 1,265 | 1,351 | $77,729.23 | −41.81% |
| Jan – May 2026 (after) | 1,973 | 2,067 | $125,193.83 | +29.3% |
- Ordered product sales for January to May 2026 were $125,193.83, against $96,820.41 for January to May 2025.
- Order items and units ordered both rose 22.2% year on year, after falling 46% and 44% in late 2025.
- Across the full captured advertising history, PPC generated $33,829.91 in sales from 567 purchases at 20.87% ACoS.
Straight from the account
Unedited screenshots from Amazon Seller Central, the Advertising Console and the account's reporting tools, with date ranges left visible.
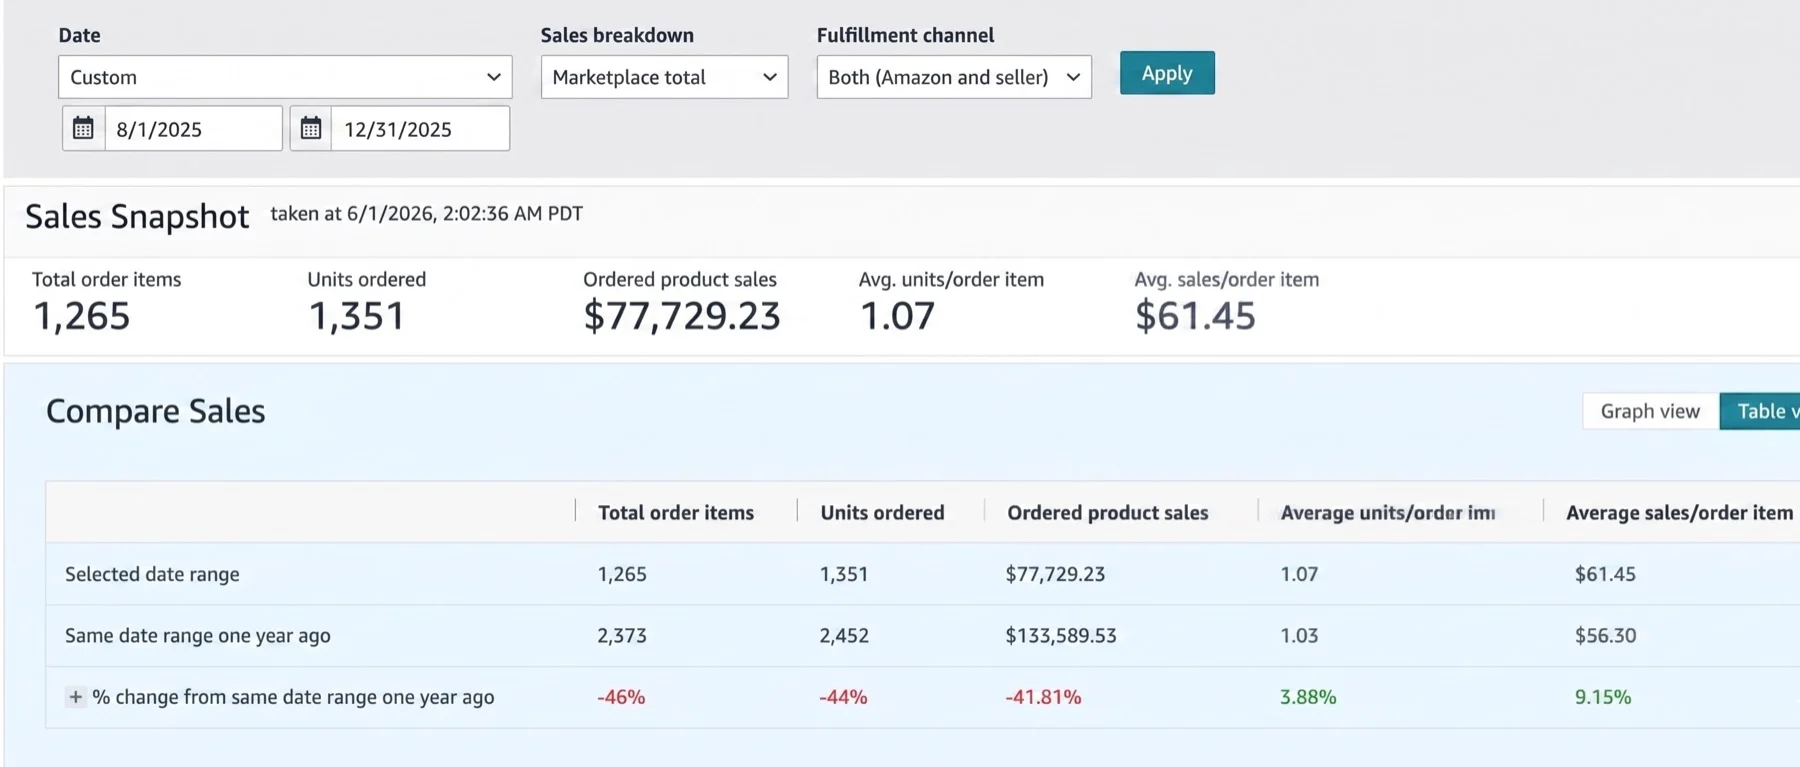
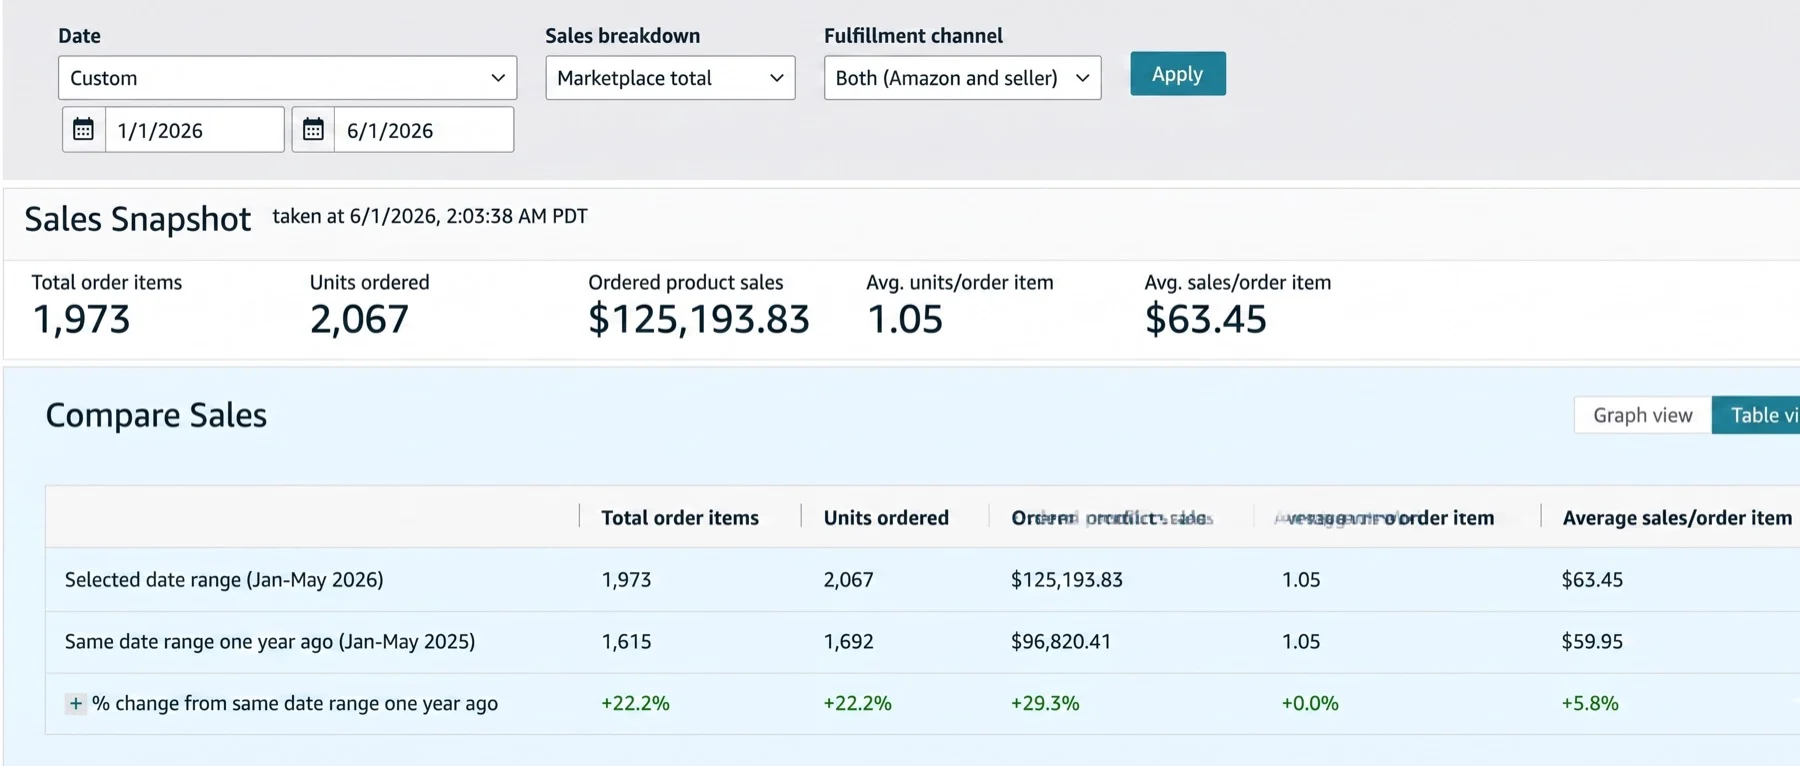
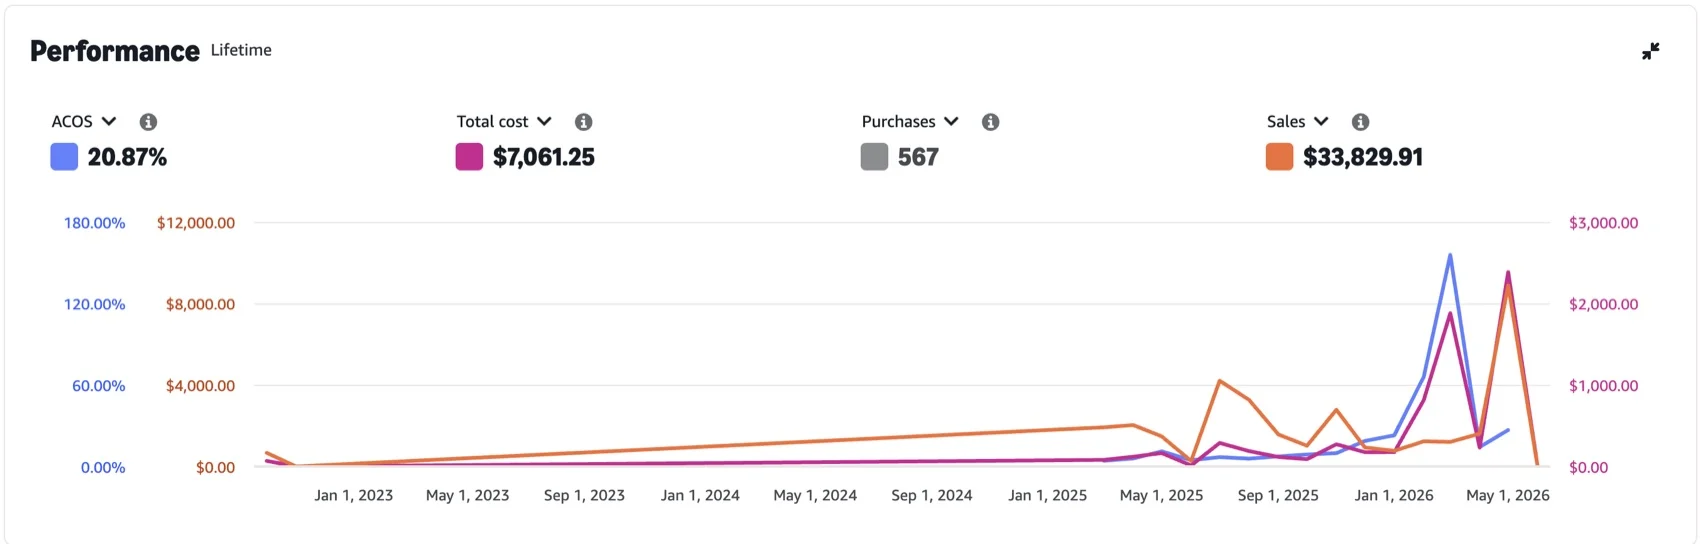
Brand names, store names, seller identities and ASINs are not disclosed. Every screenshot keeps its date range visible.
More case studies
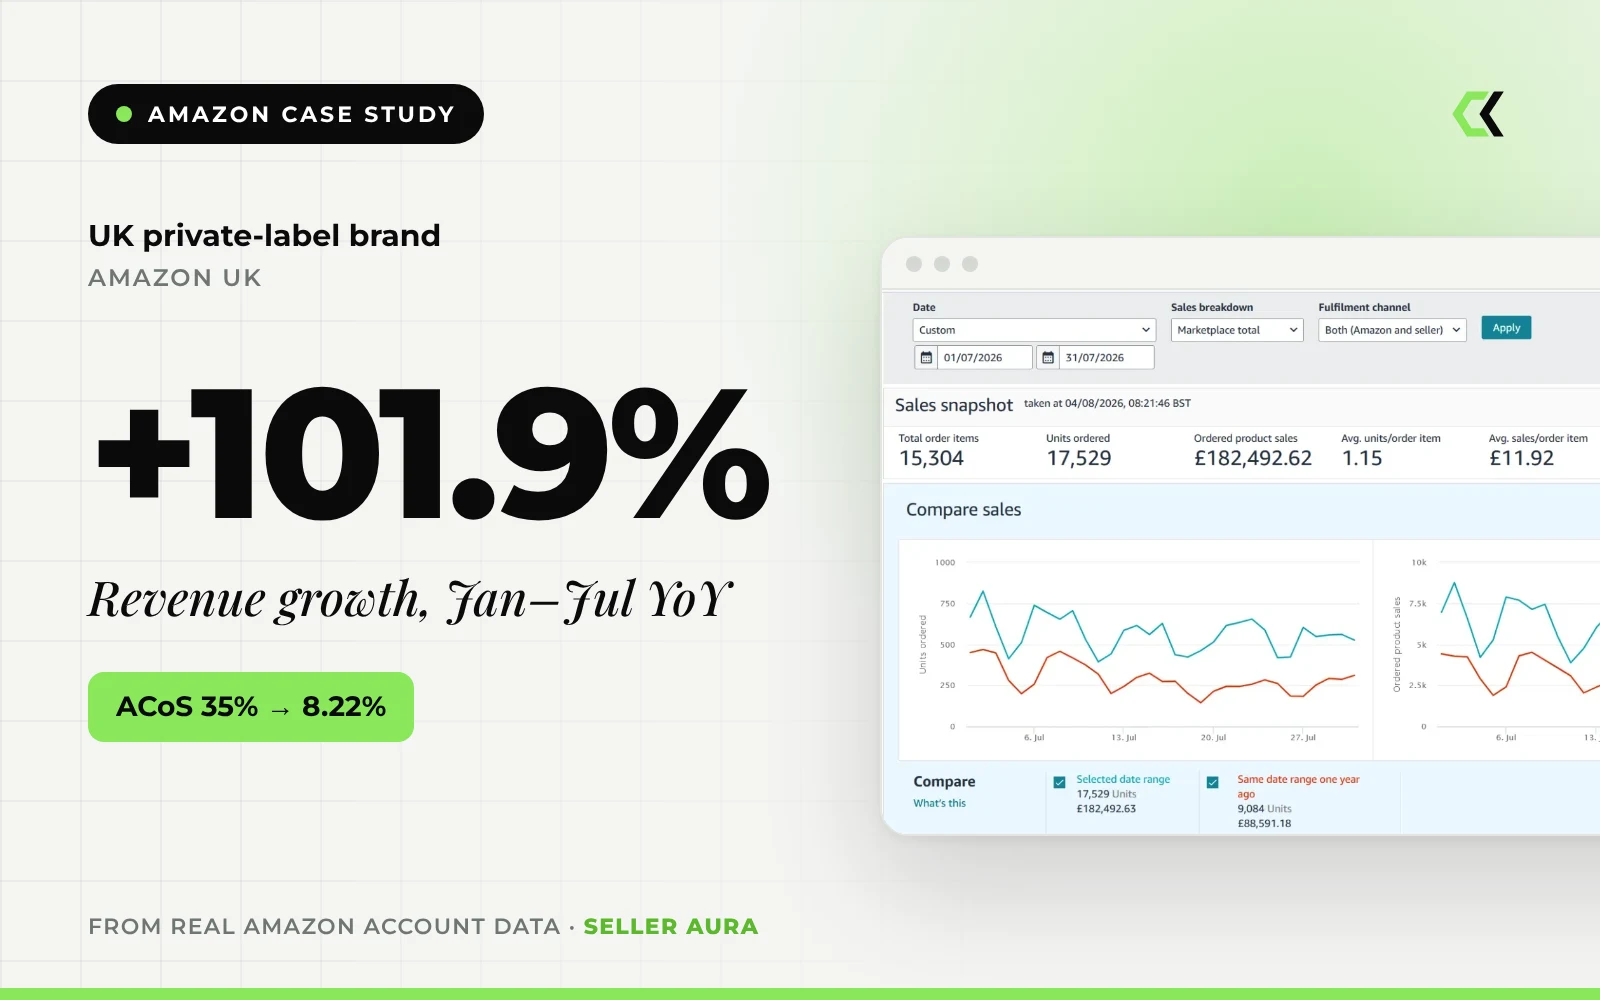
Year-to-date revenue growth for a UK private-label brand, while ACoS fell from about 35% to 8.22%
Read case study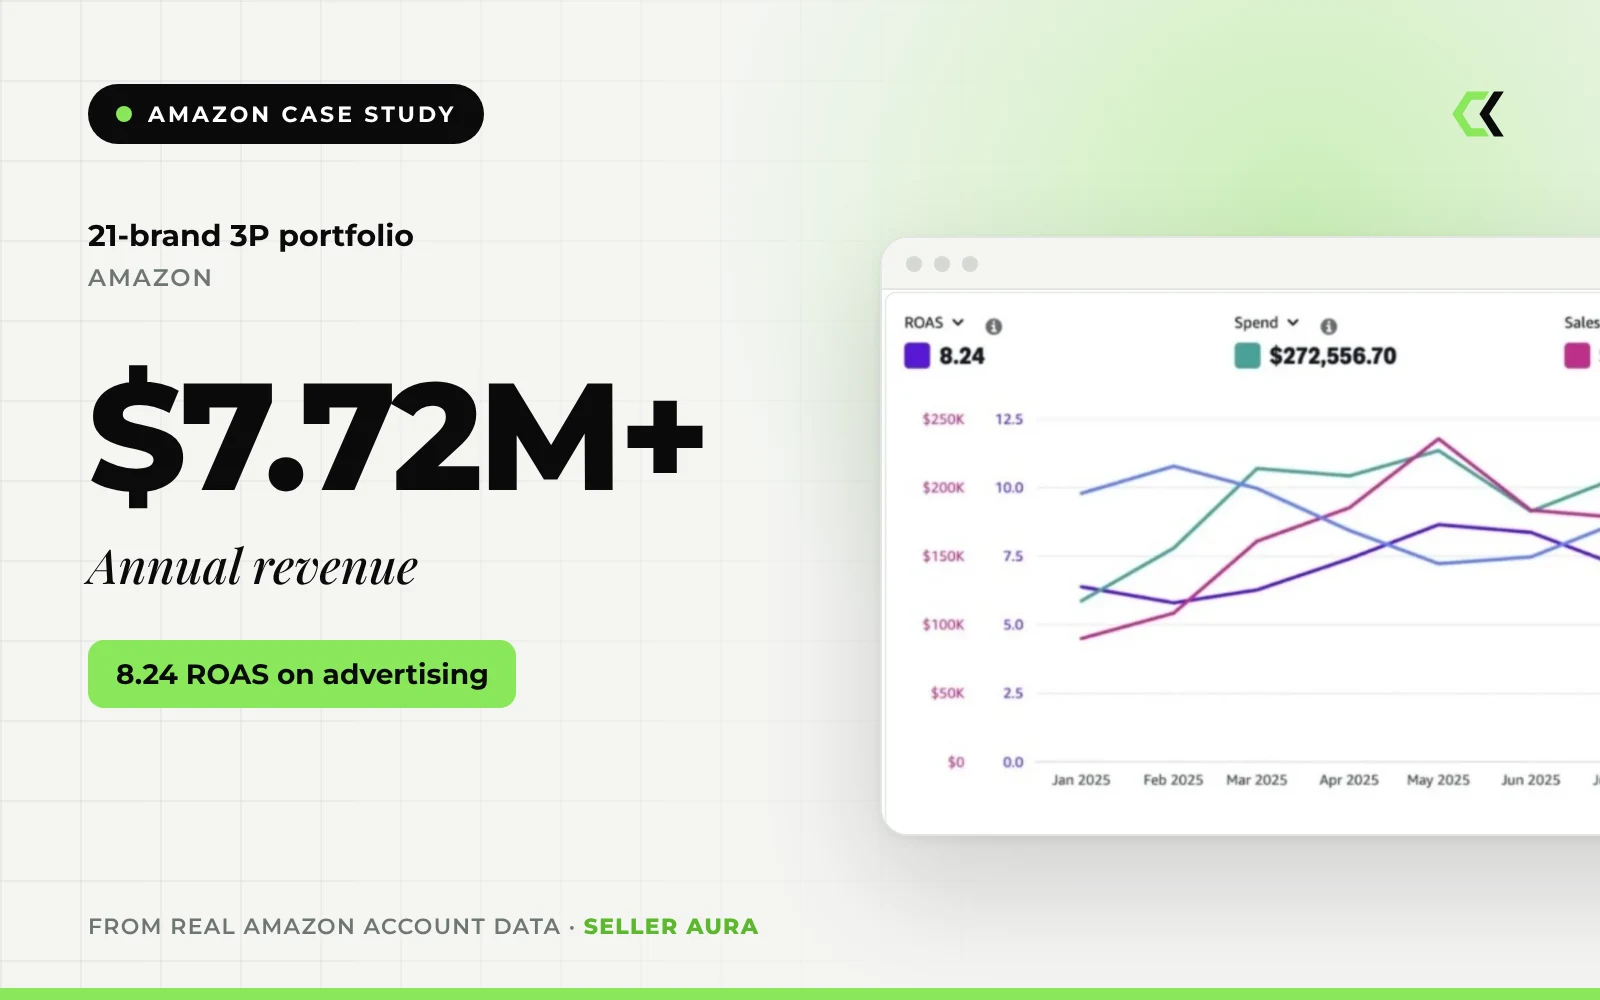
Annual revenue across a 21-brand Amazon 3P portfolio, with advertising at 8.24 ROAS
Read case study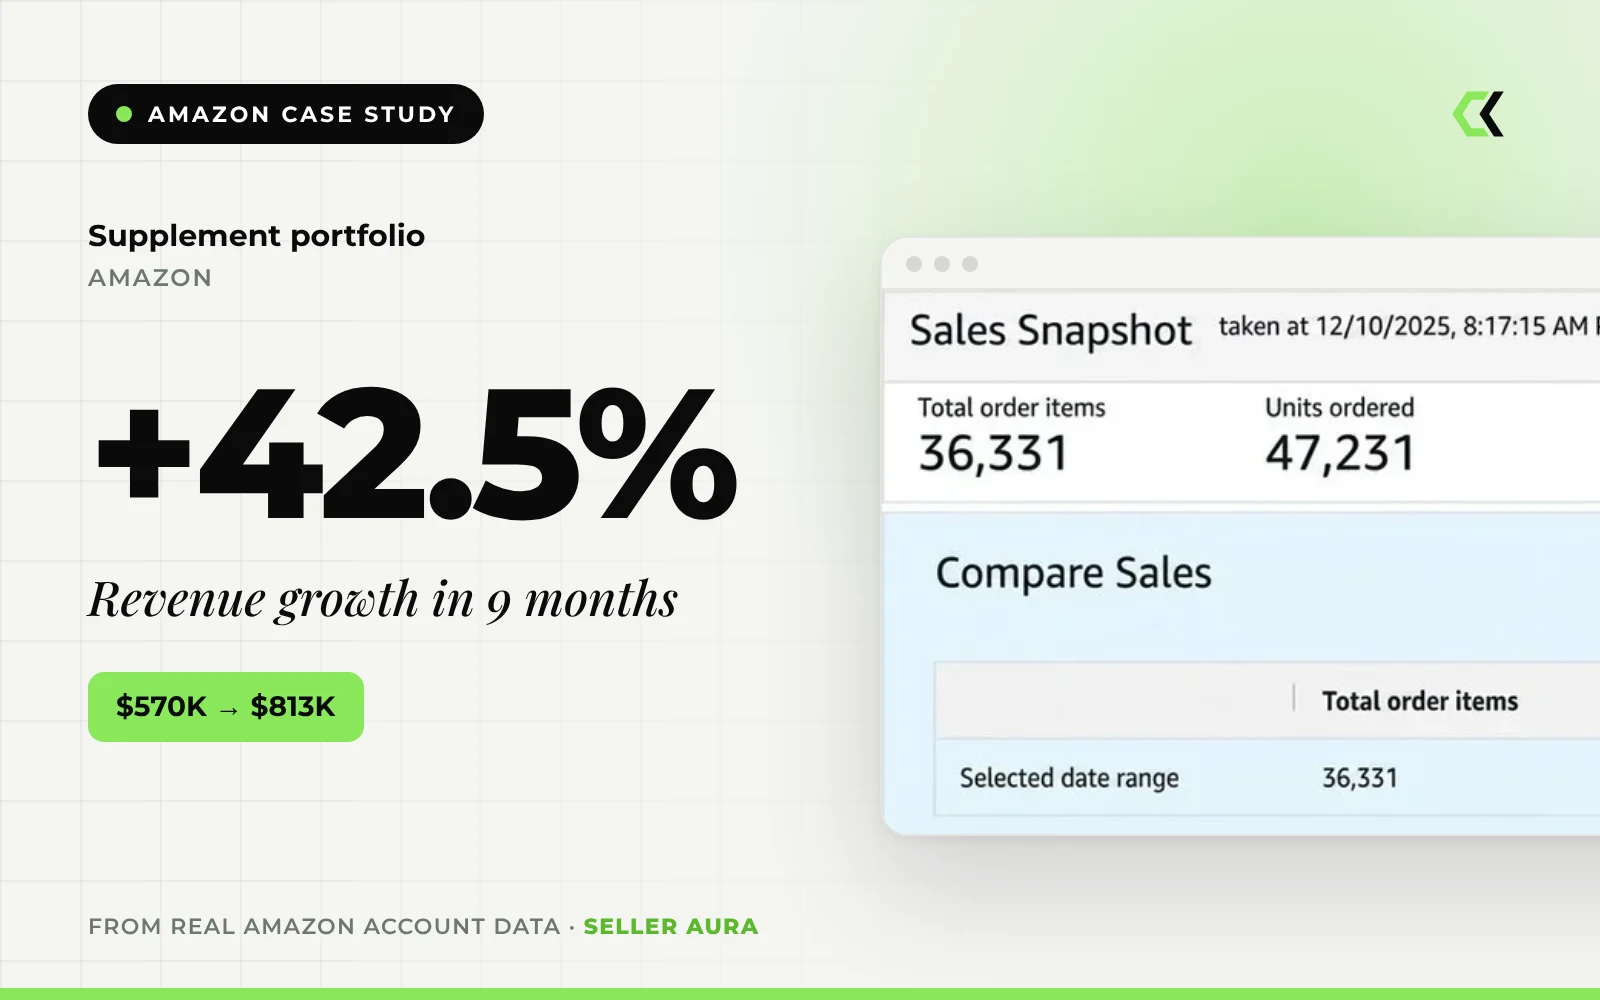
Revenue growth for a supplement portfolio, from $570K to $813K in a 9-month window
Read case studyWant results like these?
Tell us where you sell and what you want to achieve. We will come back with a clear, practical plan, free of charge.