
Scaling a multi-marketplace brand with PPC automation
A low-price, high-competition brand selling across a dozen Amazon marketplaces needed to scale without sacrificing margin. Seller AURA built a per-SKU bidding-stack automation strategy that grew sales while holding a lean Real ACoS.
The account
This is a business of low prices and fierce competition, where every point of ACoS matters. Growing it efficiently across multiple marketplaces meant solving manual effort, imprecise bidding and the tension between scale and margin.
Seller AURA automated the repetitive parts of PPC management, so operators could focus on strategy.
What was holding growth back
High manual effort
Managing PPC by hand across a large catalogue took enormous operator time.
Many marketplaces at once
Multiple marketplaces had to be monitored and advertised in simultaneously.
Suboptimal bid adjustments
Reactive, imprecise bidding led to inefficient spend.
Scale versus margin
Scaling risked compromising Real ACoS and gross margin.
How Seller AURA approached it
Per-SKU bidding stacks
A planned bidding stack for each SKU's campaigns in each marketplace, with high-barrier stacks on SKAG campaigns.
Rolling performance windows
Target bids adjusted on a rolling 30 to 90-day performance window.
Automated keyword import
Rules continuously imported new keywords per SKU using a custom ad-group strategy.
Account-wide propagation
A shared stack meant an improvement to one SKU applied across the whole account at once.
What changed
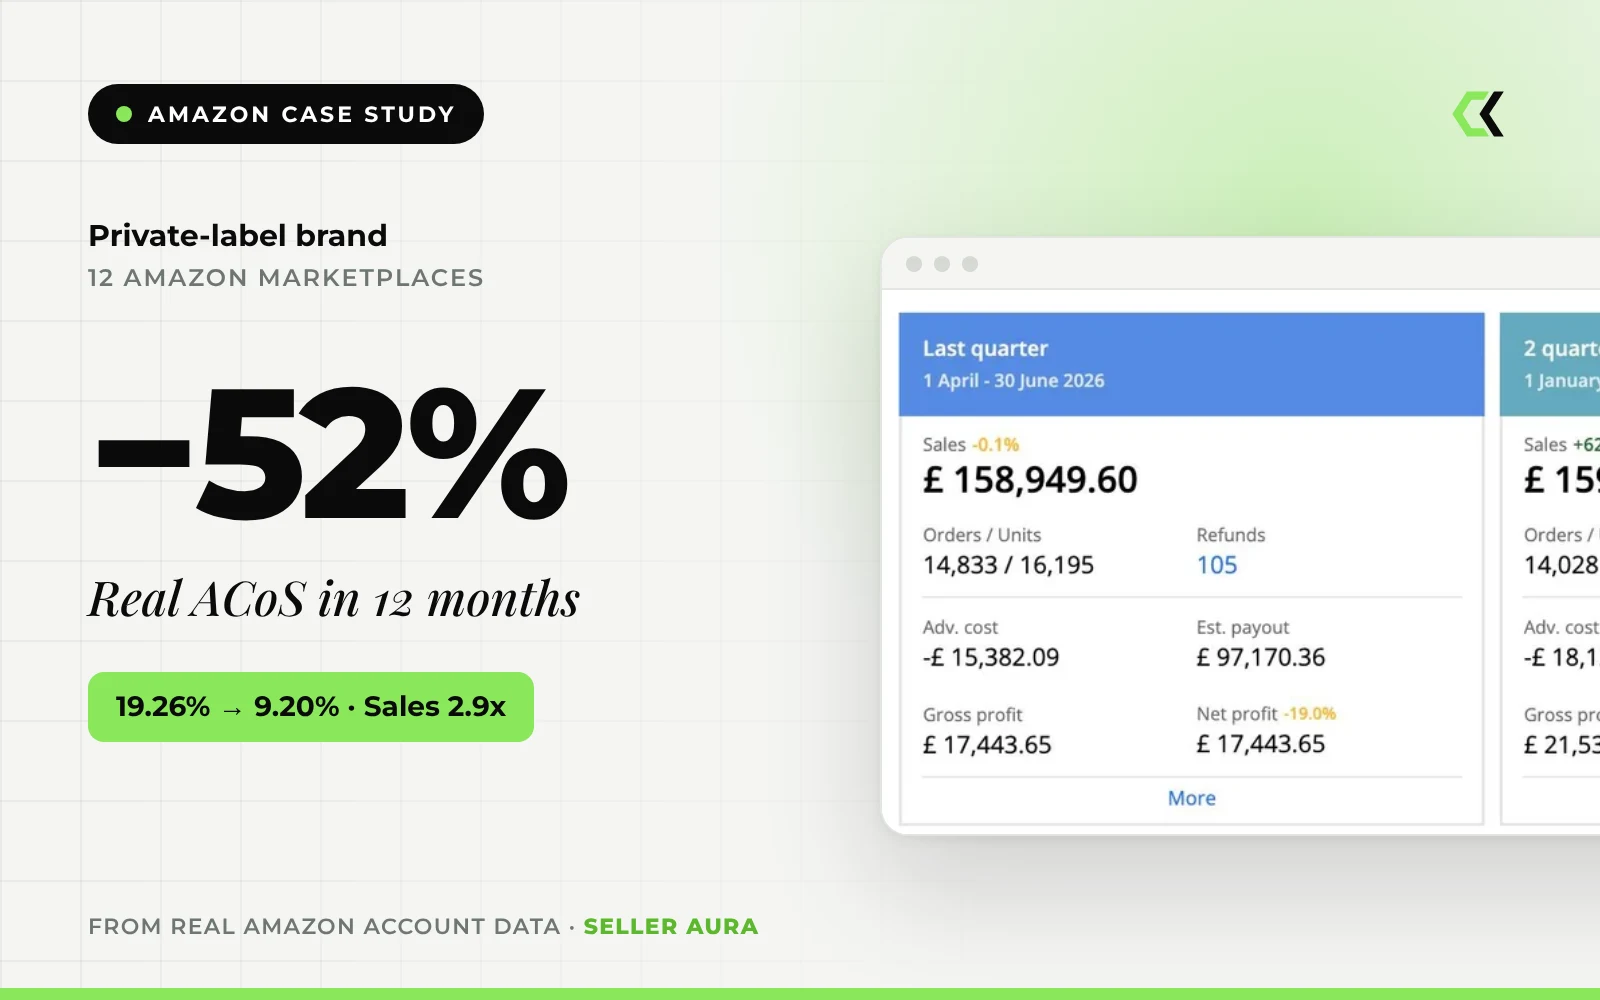
- Monthly sales rose from £21,830.18 in July 2025 to £63,063.46 in June 2026.
- Real ACoS fell from 19.26% to 9.20% over the same period, as spend kept scaling.
- Quarterly sales grew from £81,028 (Jul–Sep 2025) to £158,950 (Apr–Jun 2026).
- From July 2025 to mid-July 2026, £530,799.54 in sales delivered £52,551.38 in net profit after ad spend, Amazon fees, cost of goods and VAT.
Straight from the account
Unedited screenshots from Amazon Seller Central, the Advertising Console and the account's reporting tools, with date ranges left visible.
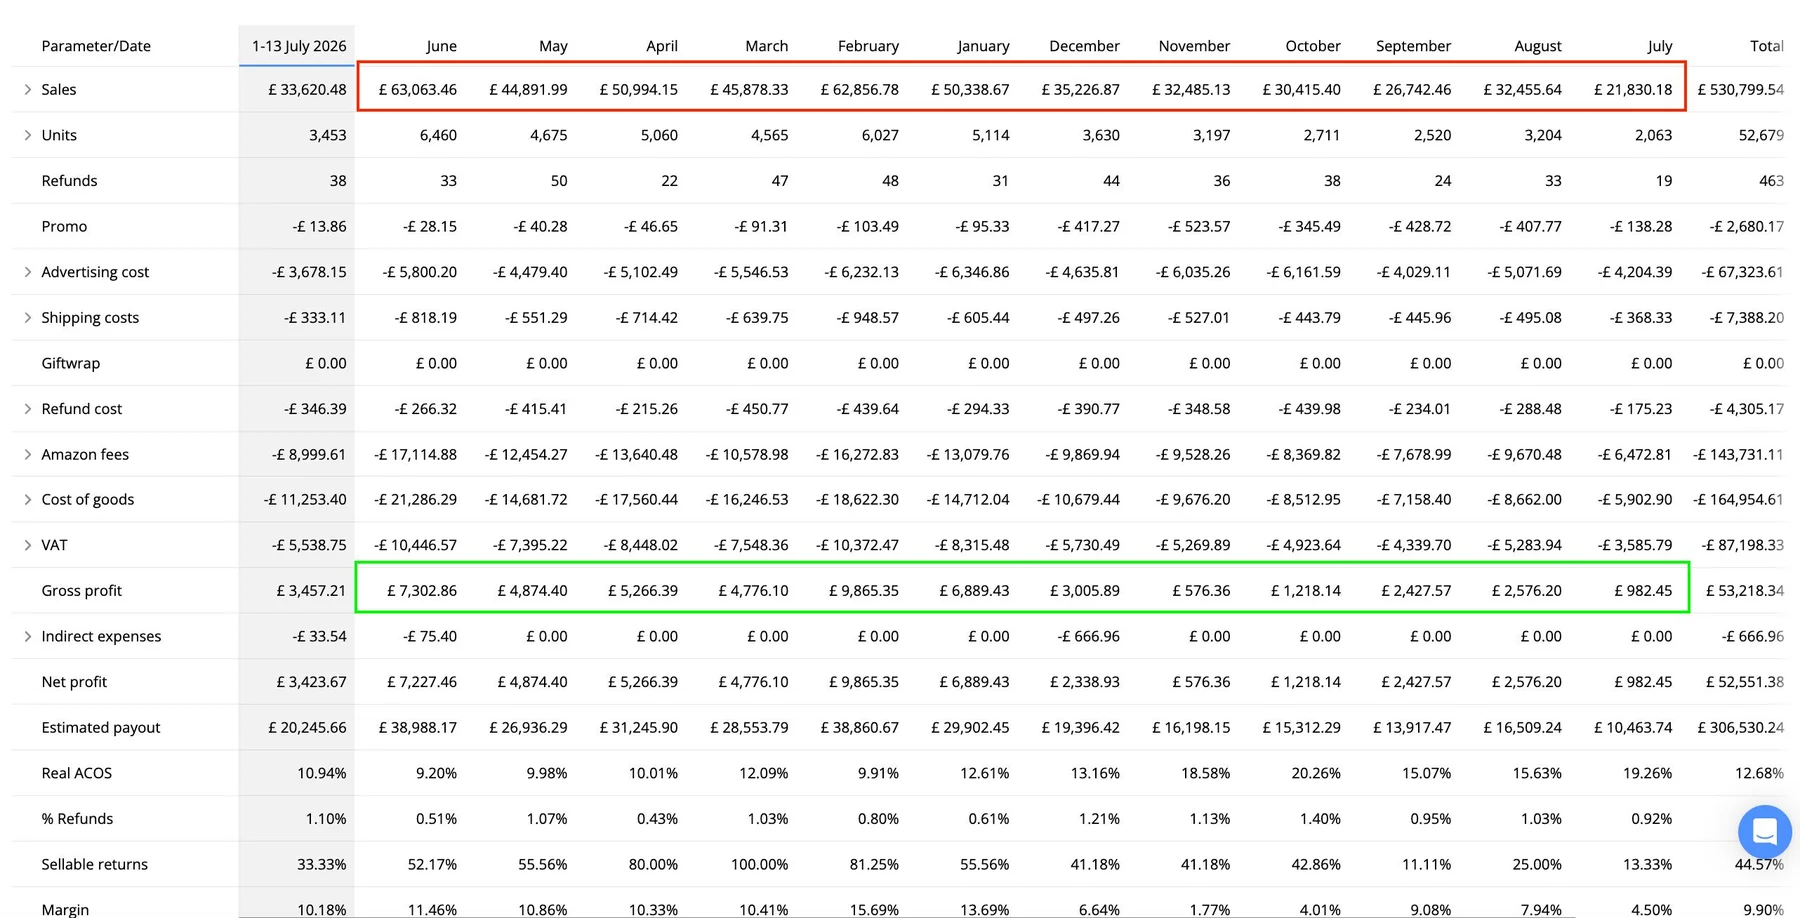
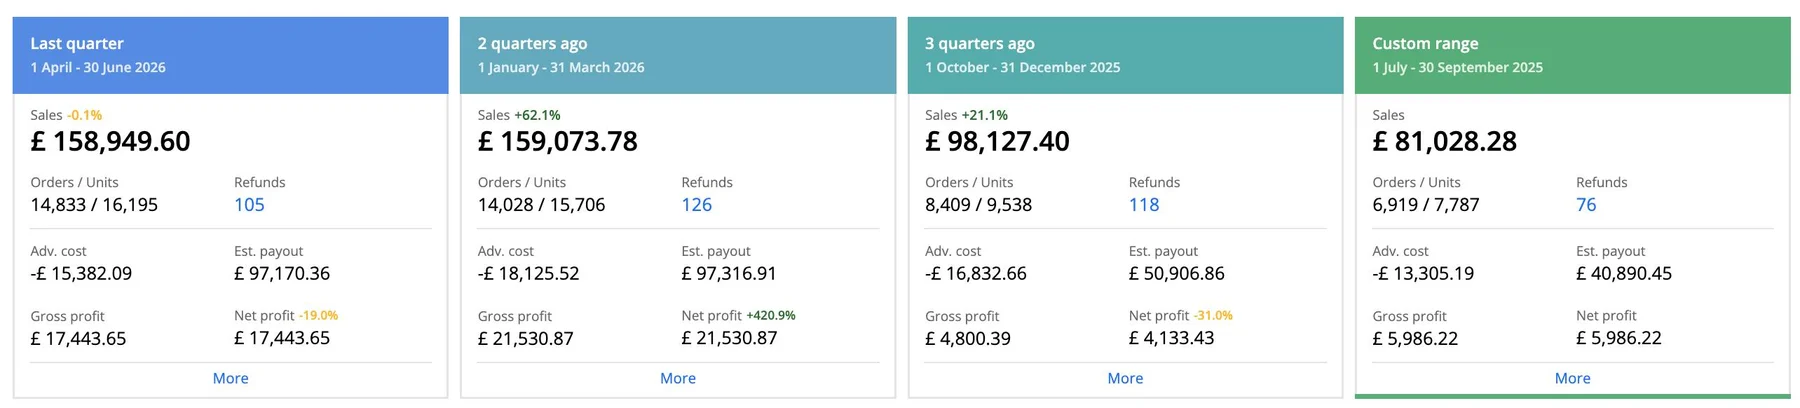
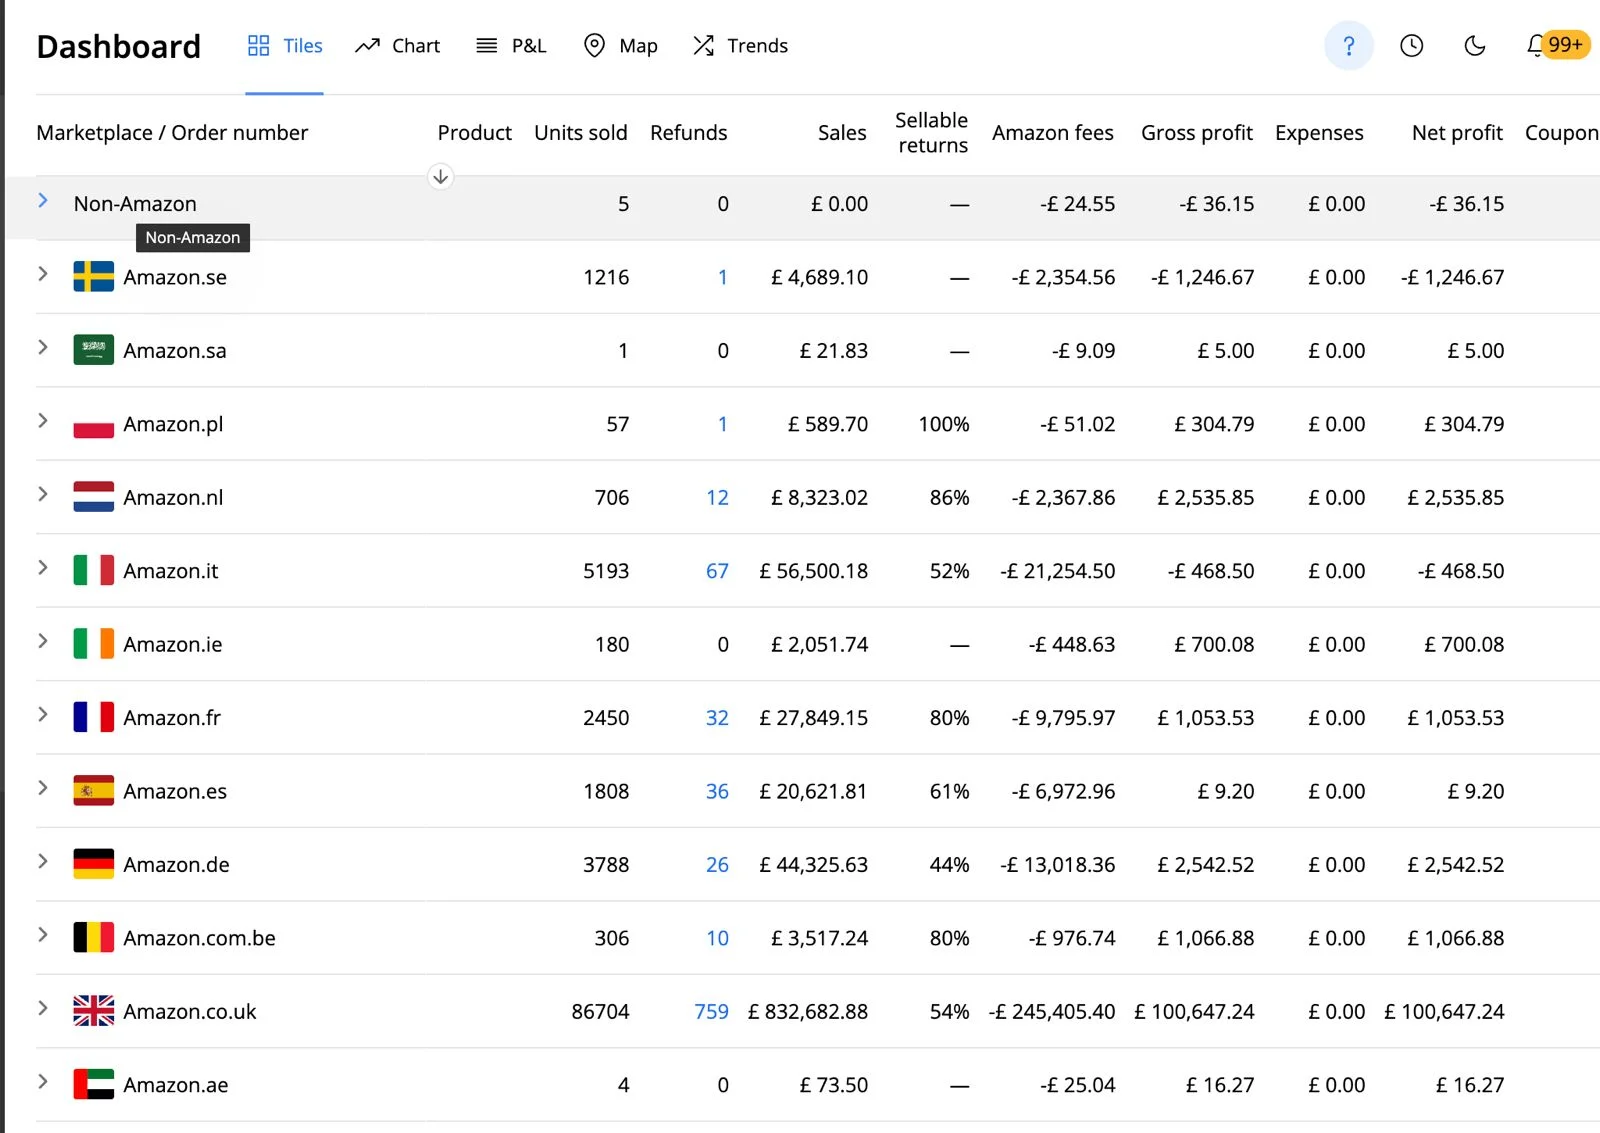
Brand and account identities are not disclosed. Screenshots are from the account's profit analytics dashboard.
More case studies
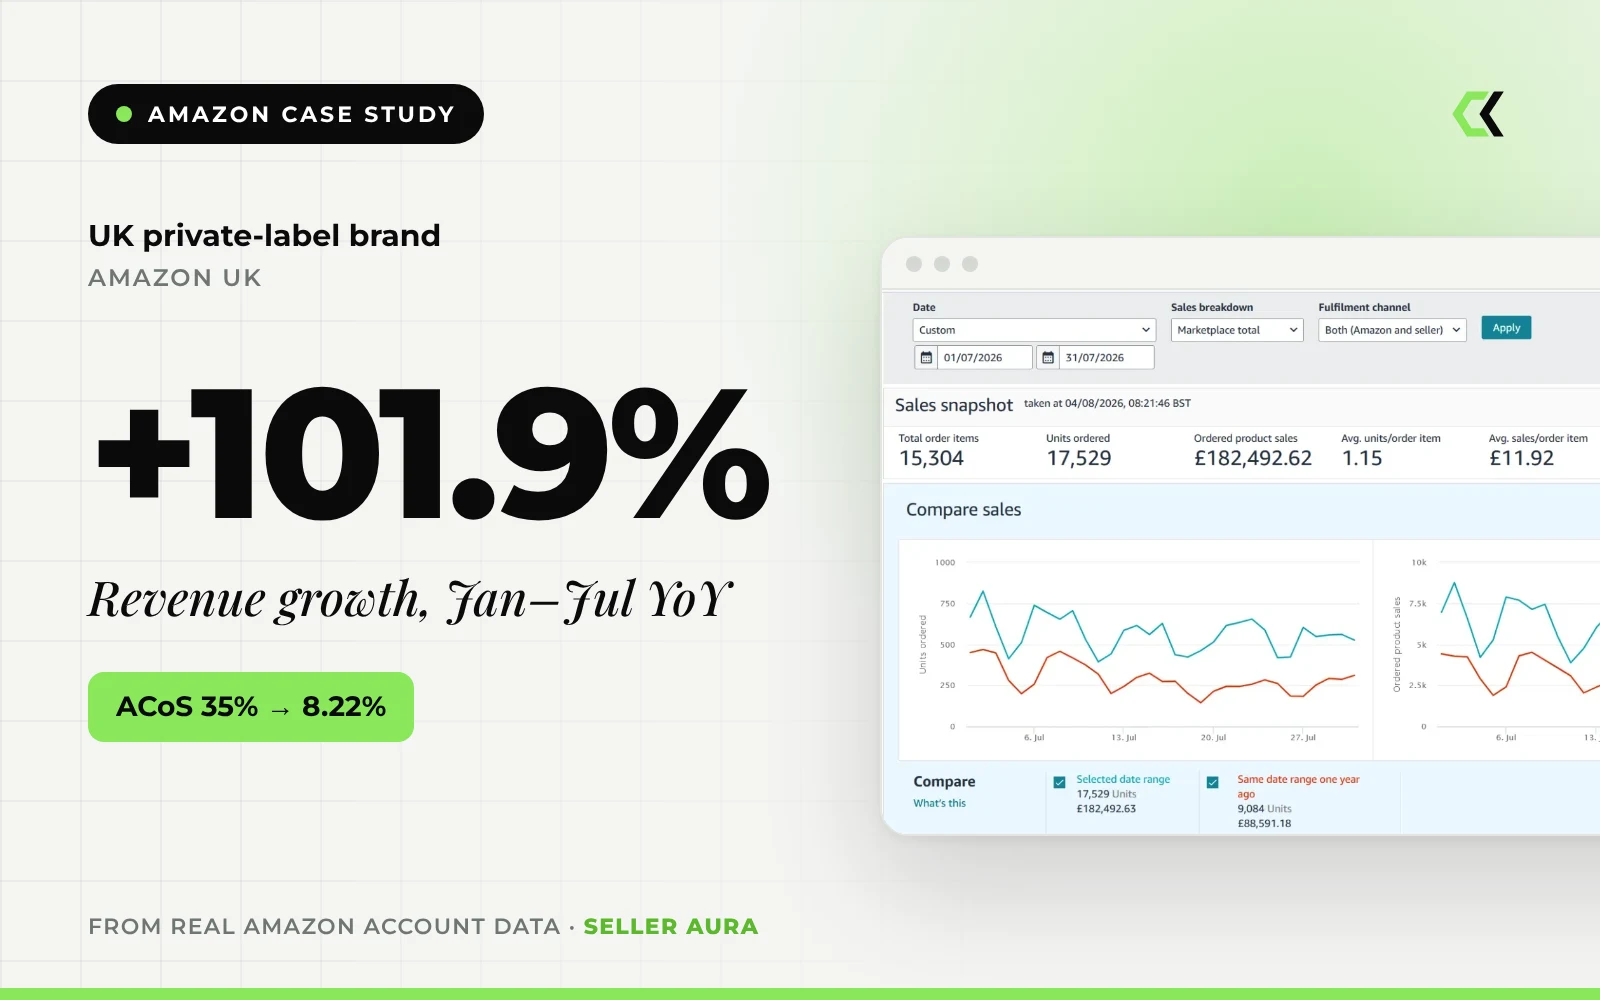
Year-to-date revenue growth for a UK private-label brand, while ACoS fell from about 35% to 8.22%
Read case study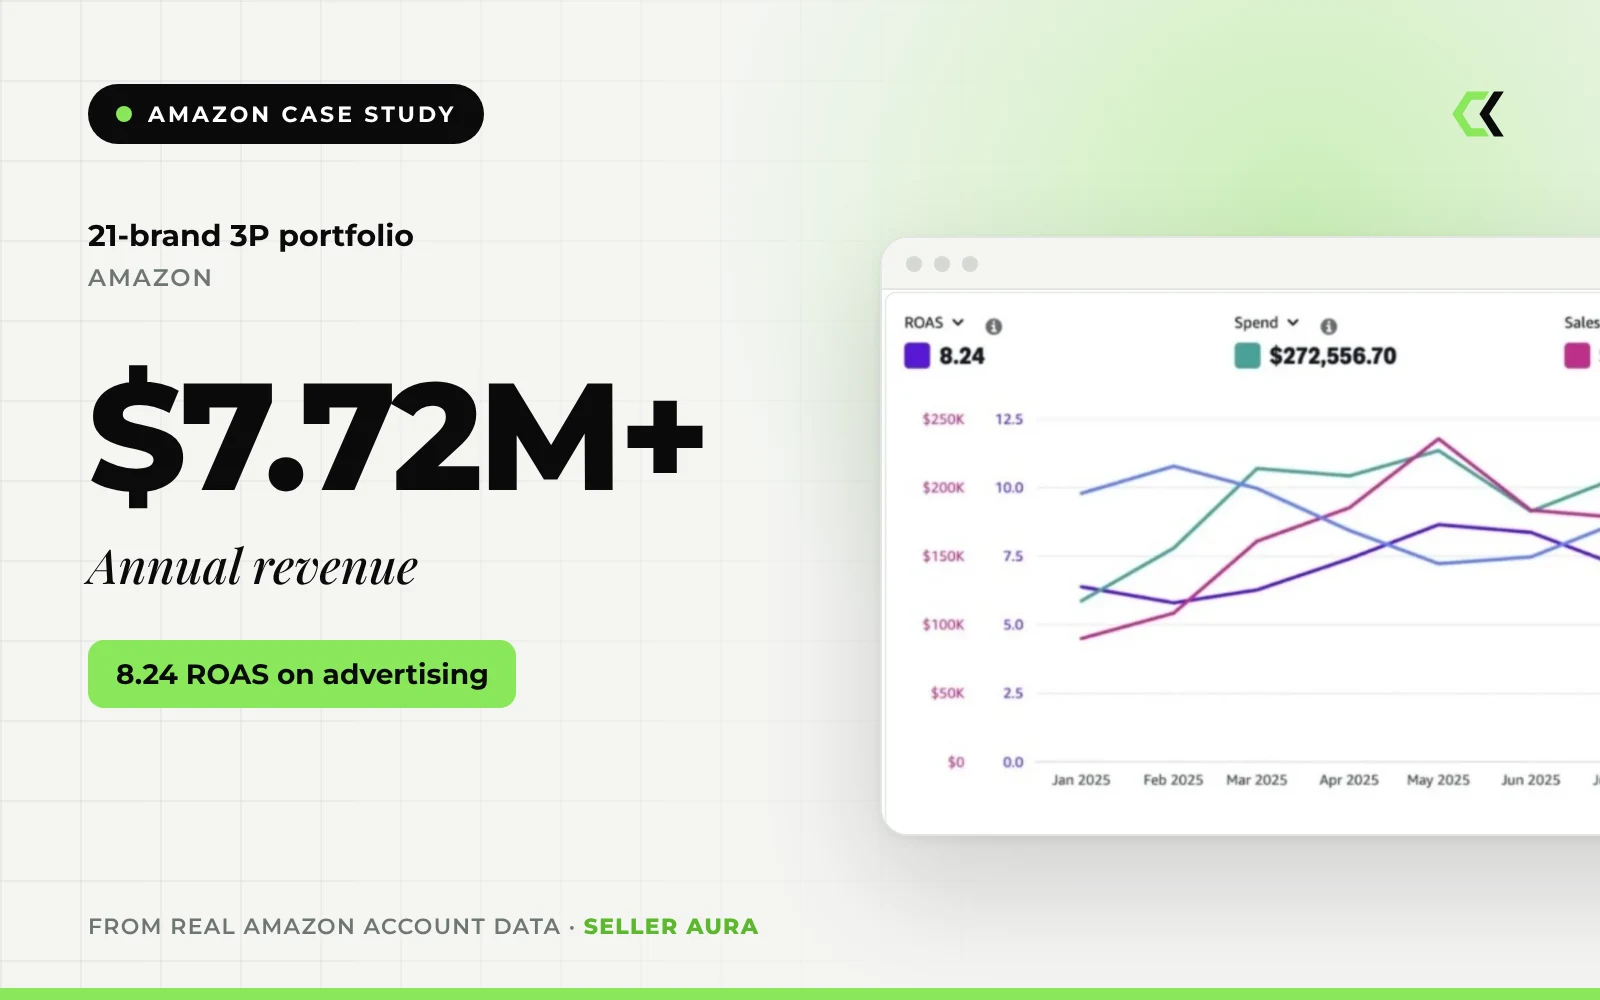
Annual revenue across a 21-brand Amazon 3P portfolio, with advertising at 8.24 ROAS
Read case study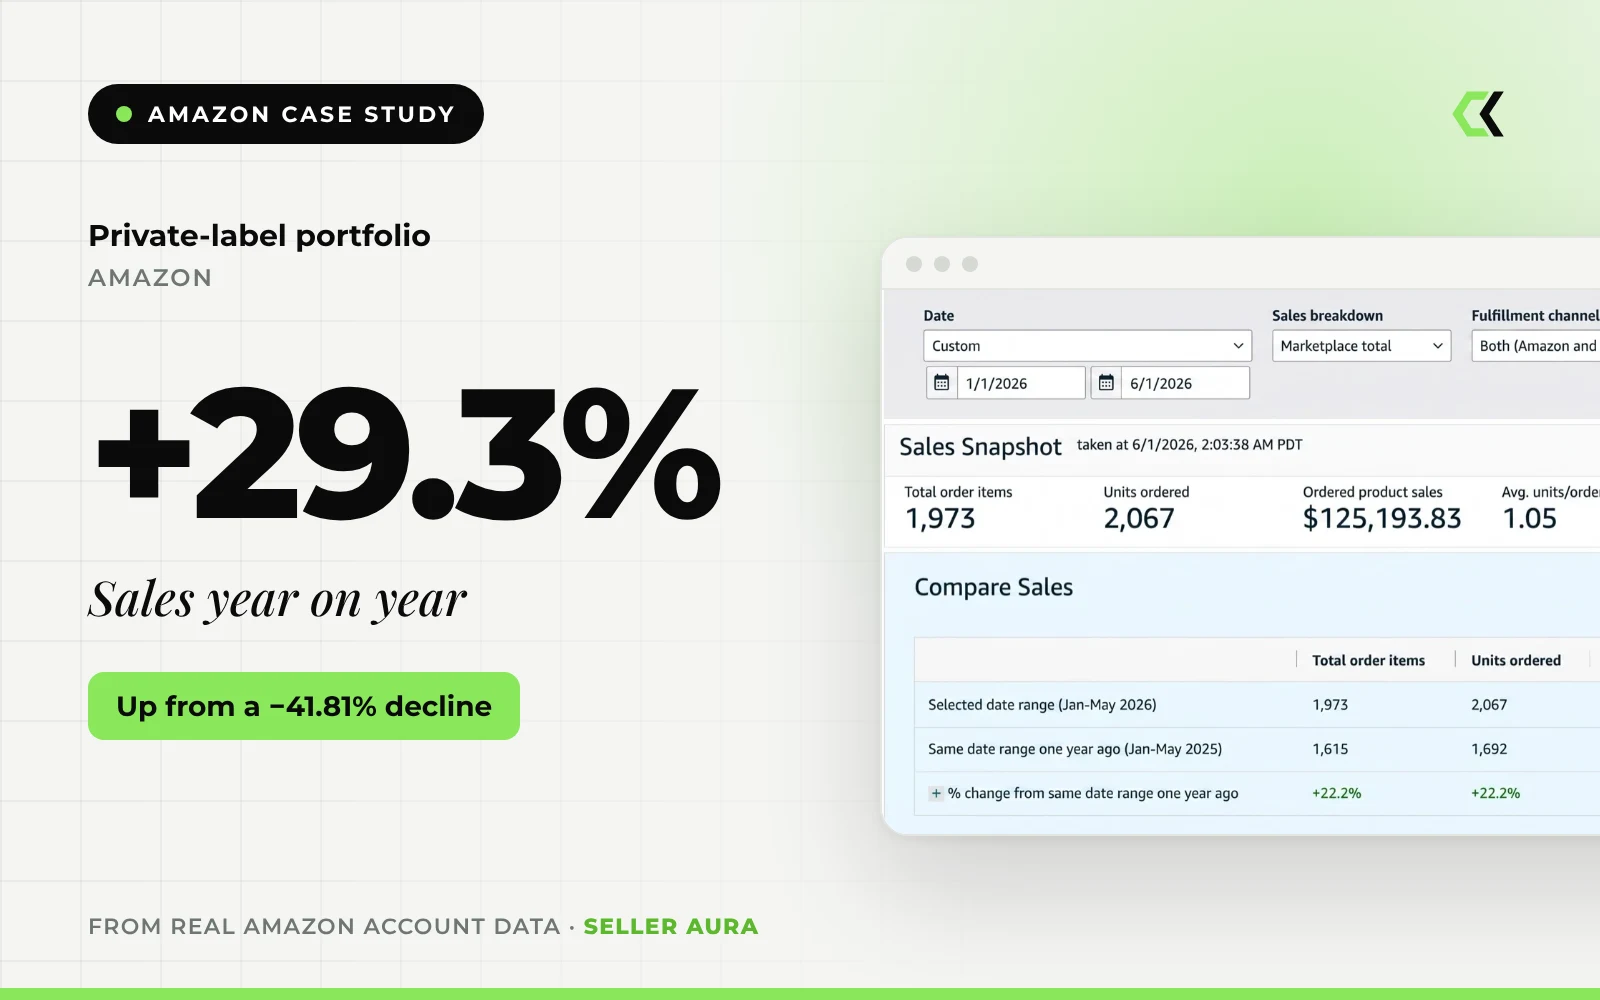
Year-on-year sales growth for a private-label portfolio that had been declining by 41.81%
Read case studyWant results like these?
Tell us where you sell and what you want to achieve. We will come back with a clear, practical plan, free of charge.